Blog

  • House View | ALNY: Cuando el mercado confunde una desaceleración con un deterioro estructural

    House View | ALNY: Cuando el mercado confunde una desaceleración con un deterioro estructural

    House View | Rafael Acevedo, CEO de BalladMarkets.com

    Tesis Humana Inicial Neuronal
    Análisis técnico validado por Darwin | Motor de inteligencia de inversión Chesko 2.0

    En BalladMarkets no buscamos compañías que simplemente hayan caído. Buscamos momentos en los que el mercado sobrerreacciona y el precio se desvía significativamente del valor fundamental del negocio.

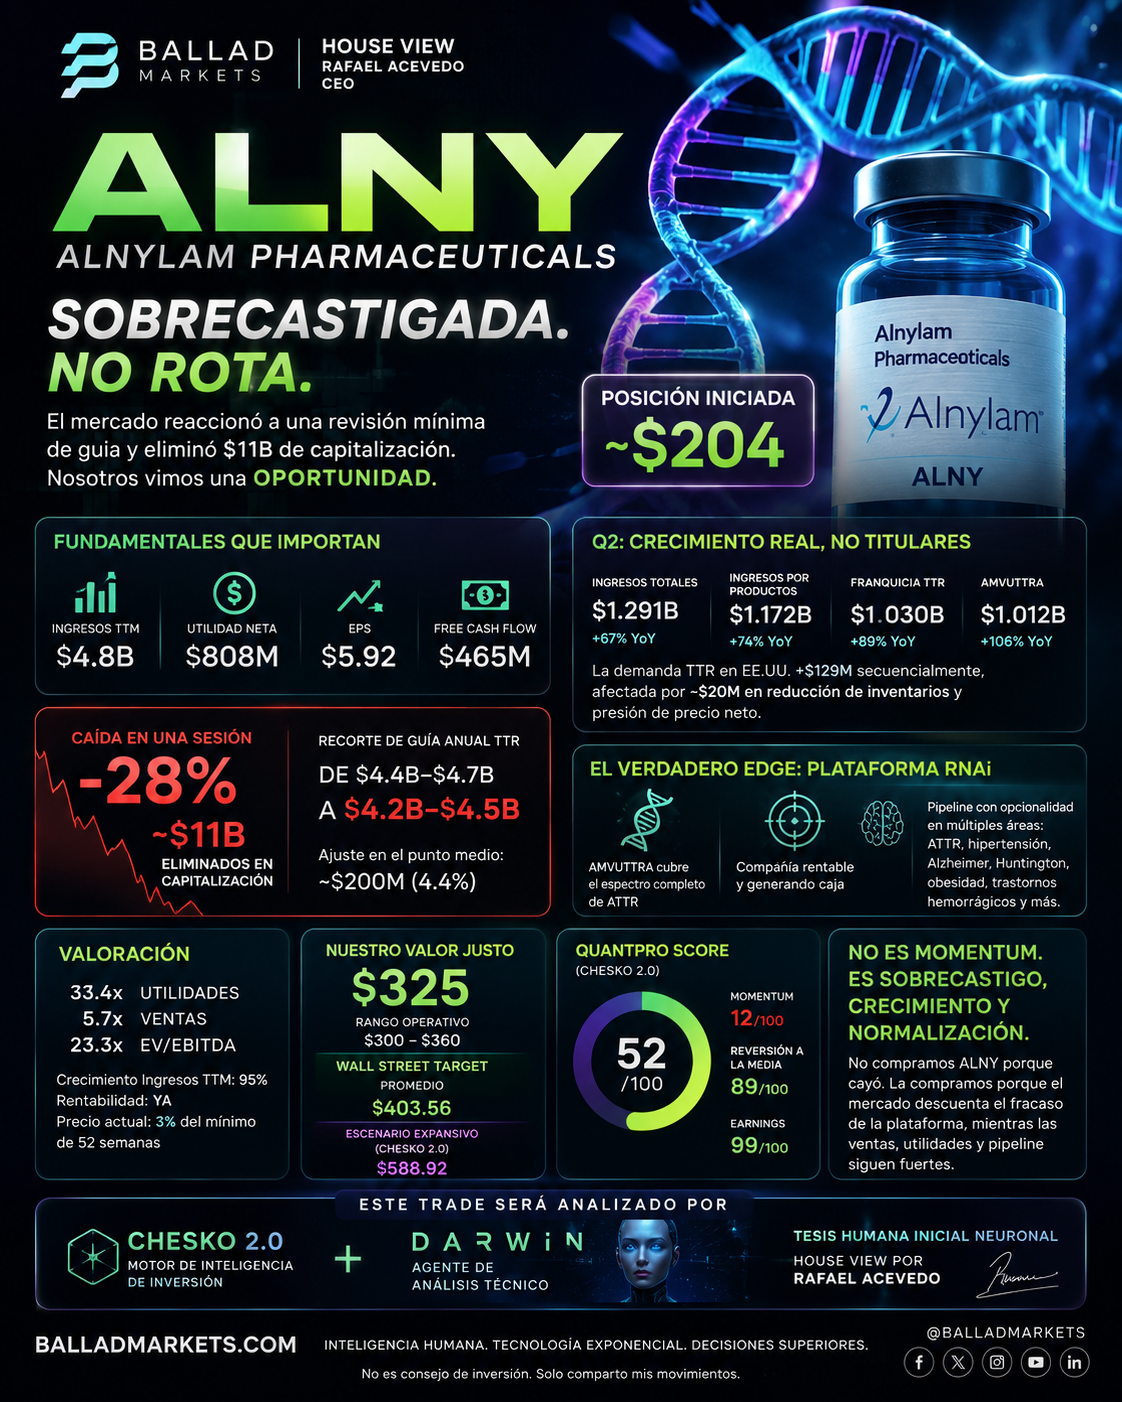
    Bajo esa premisa, hemos iniciado una posición en Alnylam Pharmaceuticals (NASDAQ: ALNY) alrededor de los 204 dólares.

    Nuestra tesis parte de una lectura sencilla: el mercado parece estar descontando un deterioro estructural de la compañía cuando, en nuestra opinión, los datos reflejan una desaceleración puntual dentro de un negocio que continúa creciendo con fuerza.

    ¿Qué provocó la caída?

    ALNY perdió aproximadamente un 28% en una sola sesión, eliminando cerca de 11.000 millones de dólares de capitalización bursátil.

    El detonante fue la revisión de la guía anual de ventas de su franquicia TTR, que pasó de un rango de 4.400–4.700 millones a 4.200–4.500 millones de dólares.

    En términos prácticos, el ajuste representa apenas unos 200 millones de dólares en el punto medio de la previsión, alrededor del 4,4%.

    La magnitud de la caída del precio parece haber sido muy superior al deterioro real de las expectativas del negocio.

    Lo que los fundamentales muestran

    Mientras gran parte del mercado reaccionaba al titular, los resultados financieros cuentan una historia diferente.

    • Ingresos TTM: 4.800 millones de dólares.
    • Beneficio neto: 808 millones.
    • EPS: 5,92 dólares.
    • Free Cash Flow: aproximadamente 465 millones.

    Durante el segundo trimestre:

    • Los ingresos totales crecieron un 67% interanual, alcanzando 1.291 millones de dólares.
    • Los ingresos por productos aumentaron un 74%.
    • La franquicia TTR registró un crecimiento del 89%.
    • AMVUTTRA superó los 1.000 millones de dólares en ventas, creciendo un 106% frente al año anterior.

    En nuestra opinión, estos datos no describen una empresa en deterioro. Describen una compañía que sigue expandiendo su negocio mientras el mercado ajusta expectativas sobre la velocidad de crecimiento.

    La verdadera tesis

    El activo más importante de Alnylam no es un único medicamento.

    Es su plataforma de terapias basadas en RNA de interferencia (RNAi).

    La compañía ya ha demostrado que puede convertir innovación científica en productos comercializados y rentables.

    Además de AMVUTTRA, mantiene programas con potencial en áreas como:

    • hipertensión,
    • enfermedad de Alzheimer,
    • enfermedad de Huntington,
    • obesidad,
    • trastornos hemorrágicos,
    • nuevas indicaciones dentro del espectro ATTR.

    Esta diversificación reduce la dependencia de un único producto y mantiene abierta una importante opcionalidad de crecimiento para los próximos años.

    Valoración

    Tras la corrección, ALNY cotiza aproximadamente a:

    • 33,4 veces beneficios
    • 5,7 veces ventas
    • 23,3 veces EV/EBITDA

    No hablamos de una acción barata desde una perspectiva tradicional de múltiplos.

    Sin embargo, esos múltiplos corresponden a una empresa cuyos ingresos han crecido cerca del 95% durante los últimos doce meses y que ya ha cruzado hacia una etapa de rentabilidad sostenida.

    En nuestra valoración interna, estimamos un valor razonable operativo cercano a 325 dólares, con un rango de entre 300 y 360 dólares.

    Como referencia, el consenso de Wall Street mantiene un precio objetivo medio cercano a 404 dólares.

    Validación mediante Chesko 2.0 y Darwin

    La tesis fundamental fue desarrollada inicialmente bajo nuestro modelo de Tesis Humana Inicial Neuronal, liderado por Rafael Acevedo.

    Posteriormente fue evaluada mediante:

    Chesko 2.0, encargado de integrar fundamentos, valoración, riesgo y escenarios de mercado.

    Y Darwin, nuestro nuevo agente especializado en análisis técnico, que estudia estructura del precio, soportes, resistencias, momentum, reversión estadística y probabilidad de continuación.

    El resultado de ambos sistemas coincide con la hipótesis principal:

    No estamos frente a una operación basada en impulso. Estamos ante una posible oportunidad de sobrecastigo donde el precio parece haberse alejado más rápido que el deterioro real del negocio.

    Riesgos

    Toda inversión implica incertidumbre.

    Los principales riesgos que identificamos son:

    • una desaceleración mayor de AMVUTTRA,
    • presión adicional sobre precios y acceso de pacientes,
    • resultados clínicos desfavorables,
    • riesgos regulatorios propios del sector farmacéutico.

    Estos factores podrían modificar nuestra tesis si cambian significativamente los fundamentales.

    Conclusión

    En BalladMarkets creemos que las mejores oportunidades suelen aparecer cuando el mercado reacciona de forma desproporcionada frente a cambios relativamente pequeños en las expectativas.

    ALNY reúne varias características que consideramos atractivas:

    ✔ Crecimiento operativo sólido.
    ✔ Rentabilidad demostrada.
    ✔ Generación de flujo de caja.
    ✔ Plataforma tecnológica con múltiples oportunidades futuras.
    ✔ Corrección bursátil que, en nuestra opinión, supera ampliamente el deterioro observado en los fundamentales.

    Seguiremos monitorizando esta posición mediante nuestro proceso de análisis continuo, combinando la experiencia humana con la validación cuantitativa y técnica de Chesko 2.0 y Darwin.

    House View
    Rafael Acevedo
    CEO | BalladMarkets.com

    “La mejor inteligencia artificial no reemplaza al criterio humano; lo pone constantemente a prueba.”

    Descargo de responsabilidad: Este documento refleja únicamente nuestra opinión y nuestro proceso de análisis. No constituye asesoramiento financiero ni una recomendación de compra o venta de valores. Cada inversor debe realizar su propia investigación y evaluar su perfil de riesgo antes de tomar decisiones de inversión.
  • House View — UiPath (PATH): The AI-chain Play the Market Gave Up On

    House View — UiPath (PATH): The AI-chain Play the Market Gave Up On

    Ballad Markets · Desk View · July 2026

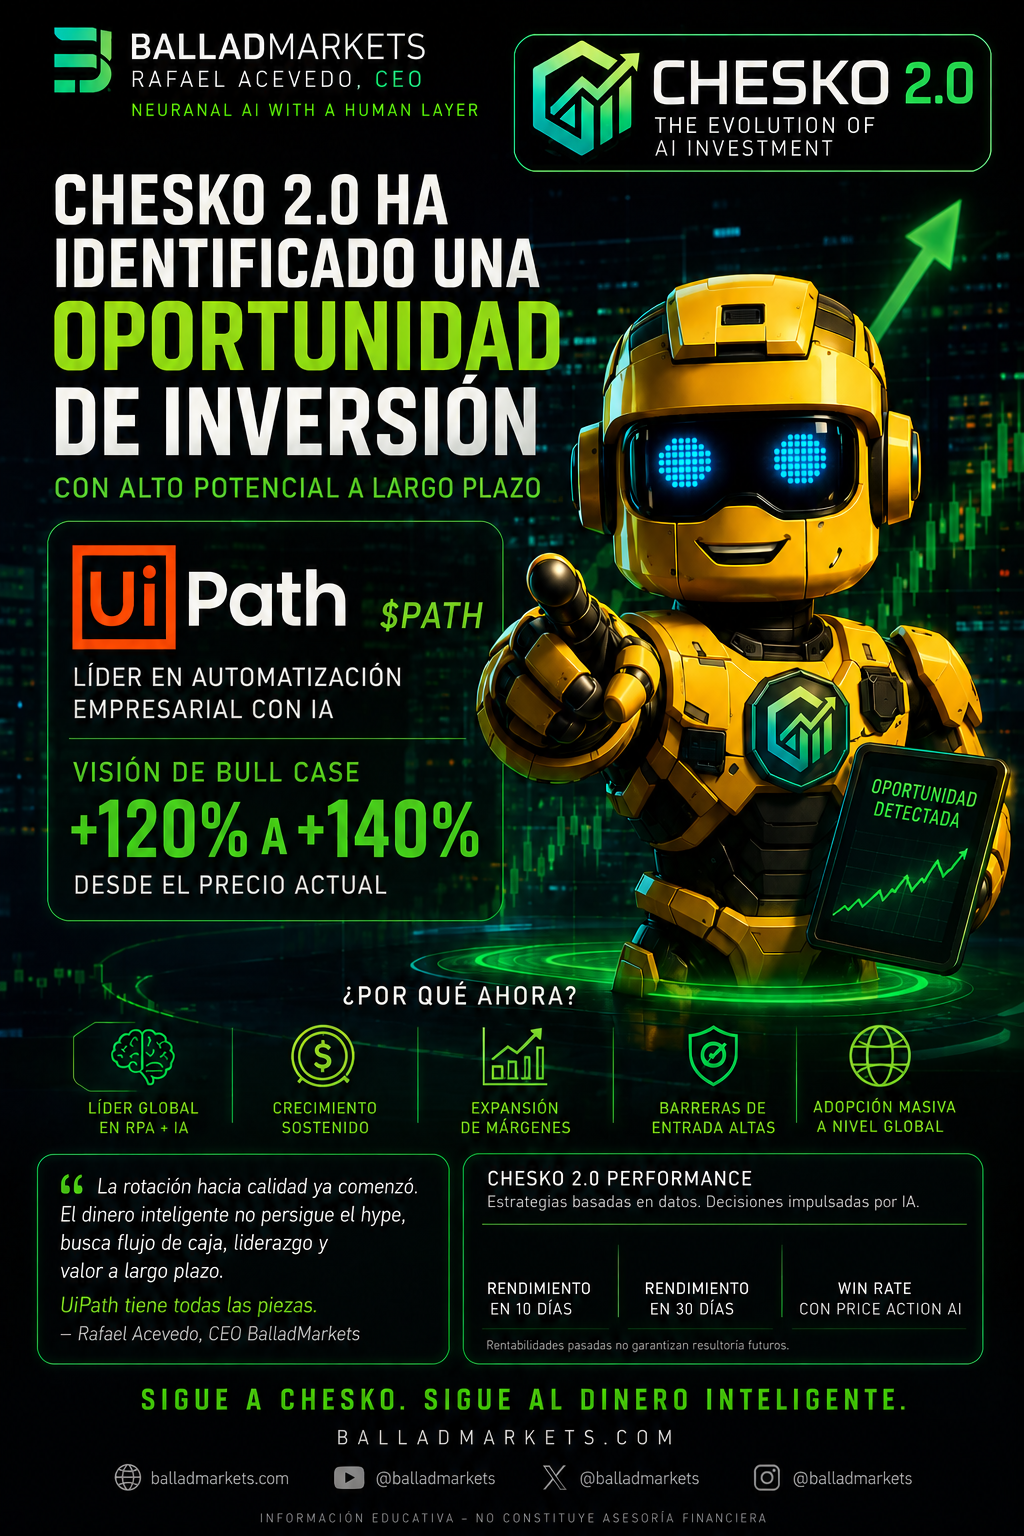
    There is a specific kind of setup this desk waits for: a company whose fundamentals are inflecting upward while its share price is making multi-year lows. Not a broken business trading cheap — a repairing business trading cheap. UiPath is that setup today.

    The stock changes hands near $10, down from roughly $12.15 earlier this month and within touching distance of its 52-week low of $9.20. Its all-time high, set in May 2021, was $85.12. The market has spent three years pricing UiPath as a melting ice cube.

    The financials no longer support that story.

    What actually happened last quarter

    UiPath reported Q1 fiscal 2027 (quarter ended April 30, 2026) on May 28:

    Metric Result
    Revenue $418M, +17% YoY
    ARR $1.901B, +12% YoY
    Net new ARR $49M
    Net retention 109%
    GAAP operating income +$28M — first positive quarter in company history
    Non-GAAP operating income $92M
    Non-GAAP gross margin 83%
    Adjusted free cash flow $130M
    Cash & securities $1.42B, no debt
    Buyback $244M of Class A stock repurchased in the quarter

    The line that matters is the fifth one. UiPath turned GAAP-profitable for the first time. For a company the market had written off as a perpetual cash-burner, that is a change in kind, not degree — and it happened while revenue still grew 17%.

    Management’s own guidance carries it forward:

    • Q2 FY27: revenue $395–400M, ARR $1.929–1.934B, non-GAAP operating income ~$75M
    • Full-year FY27: revenue $1.776–1.781B, ARR $2.058–2.063B, non-GAAP operating income ~$430M

    That full-year operating income figure against ~$1.78B of revenue implies roughly a 24% non-GAAP operating margin — from a company that ran near breakeven two years ago. Meanwhile it holds $1.42B in net cash against a market capitalisation of roughly $5.5B, meaning a quarter of the market cap is cash.

    Why the price is where it is

    We are not going to pretend the bear case doesn’t exist. On July 23, UBS cut its price target to $12 from $13 and kept a Neutral rating, reflecting broader scepticism about automation demand. That scepticism is the reason the entry exists, and it rests on a real question: does classic RPA get commoditised by general-purpose AI?

    The honest answer is that it is a genuine risk. Microsoft bundles Power Automate. Foundation-model vendors keep absorbing adjacent workflows. If enterprise automation collapses into whatever the model providers ship for free, UiPath’s moat erodes.

    Our read is that this conflates two different things. A language model can draft a process. It cannot, on its own, govern one — permissions, audit trails, deterministic retries, compliance evidence in a regulated bank. Orchestration is where the durable value sits, and orchestration is what UiPath sells.

    The AI-chain thesis

    The reason PATH enters our watchlist as a fundamental AI-chain position rather than a bounce trade: it is levered to enterprise AI deployment, not AI capability.

    The market has paid up enormously for the layer that builds intelligence — chips, compute, foundation models. It has paid almost nothing for the layer that puts that intelligence to work inside a regulated enterprise and proves it did what it claimed. Every agent an enterprise deploys needs to be scheduled, permissioned, monitored and audited. That is not a model problem. That is an orchestration problem.

    Two data points suggest the shift is already monetising. On UiPath’s Q1 call, management noted AI-attached deals sold materially larger than those without. And the customer evidence is concrete rather than theoretical:

    • Suncoast reviewed 155,000+ checks with agentic automation, stopped 400 fraud attempts, and prevented $3.3M in losses
    • USI processes data 80% faster
    • Federal Bank merged 250 records an hour, continuously — work that previously consumed a full employee day for 200–300 records

    The named enterprise base spans regulated and industrial sectors: Generali Investments, Hiscox, HUB, WEX, Libra Internet Bank, Omega Healthcare, DTE Energy, Continental Resources, Tetra Pak, Woolworths, SOCAR, TAURON, One NZ.

    These are unglamorous companies. That is the point. This is where automation gets bought with real budgets and renewed on real ROI.

    The market

    Third-party estimates put RPA and hyperautomation at roughly $22.6B in 2025 scaling toward $110B by 2034 — a high-teens compound growth rate. Gartner has placed UiPath in the Leaders quadrant for six consecutive years.

    We would treat the market-size figure as directional rather than precise; forecasts nine years out are scenarios, not facts. The relevant point is simpler: the category is growing, and the category leader trades at roughly 3× forward sales while generating cash.

    The desk’s framework

    Horizon: 3–5 years. This is a position, not a trade. The thesis needs multiple quarters of margin expansion to be repriced, and that is measured in earnings reports, not weeks.

    Scenario Revenue CAGR Op. margin Framework value
    Bull ~25% ~27% $25–28
    Base ~15% ~24% $14–16
    Bear ≤10% ~20% $8–9

    The asymmetry is what earns the position. From roughly $10, the base case is a meaningful gain, the bull case is a multiple of the current price, and the bear case is bounded — partly because $1.42B of net cash puts a floor under a business that no longer burns money.

    What invalidates this: two consecutive quarters of decelerating net-new ARR, a reversal of the GAAP profitability, or net retention breaking below ~105%. Any of those means the operating leverage story broke, and the position should be reconsidered on the evidence rather than defended.

    What we are watching next

    Q2 FY2027 results are scheduled for September 8, 2026, after the close. That is the next real test. The bar management set is revenue of $395–400M and ARR of $1.929–1.934B.

    We hold a constructive view into that print — the last four quarters have shown consistent operating discipline, and guidance has been met. But we will state plainly what we do not know: no one can predict an earnings result, and anyone who tells you they are certain of one is selling something. The position is sized for a thesis that plays out over years, precisely so that a single quarter does not decide it.


    PATH is added to the Ballad house view as our fundamental AI-chain watchlist position. CHESKO’s desk agents will run their debate on it and publish their independent read — including, if they find it, the case against.


    Ballad Markets publishes its house view for research and educational purposes. This is market commentary, not personalised investment advice, and it is not a recommendation to buy or sell any security. We may hold positions in the instruments discussed. Markets carry risk of loss; do your own work and consider your own circumstances.

  • The Quiet Rotation Into Quality Has Already Begun

    The Quiet Rotation Into Quality Has Already Begun

    House View · Rafael Acevedo, CEO, Ballad Markets

    The quiet rotation of capital has already begun. You just have not seen it in the headlines yet.

    Look at the portfolio and the pattern is unmistakable: McDonald’s, First Solar, Hormel, Matador, Duke Energy, American Electric Power, Procter & Gamble, PepsiCo. This is not a book built to chase the maximum possible growth in a euphoric market. It is a classic capital-rotation thesis — toward higher quality, stable cash flow, and resilient sectors — the move that historically happens when the economic cycle enters a more mature phase.

    It is not about abandoning risk. It is about changing which kind of risk you take.

    The macro that forces the hand

    The last two years handed the market a specific cocktail: elevated inflation, historically high rates, slowing credit, weaker discretionary consumption, and extremely demanding technology valuations. When those variables appear together, institutional money starts rotating before the move is obvious to retail — not after.

    If the US economy keeps decelerating while the Federal Reserve begins a gradual cutting cycle, the historical evidence is consistent: leadership shifts from high-growth names into defensives, utilities, consumer staples and select energy.

    The historical map

    In the last major rotation cycles — 2000, 2007, 2015, 2018, 2022 — the sectors that best protected capital were the same each time: utilities, consumer staples, traditional energy, food, and dividend aristocrats. Meanwhile growth lost leadership, unprofitable companies corrected hard, and valuations compressed back toward reality.

    The tell is relative performance, and it usually shows up long before the news does. Defensives are showing relative strength versus the S&P 500. Utilities are breaking long-term downtrends. Staples hold cleaner uptrends than the speculative complex.

    Why these eight

    • DUK — Duke Energy. A regulated utility: low beta, high earnings stability, and a bid that grows as rates fall and dividend demand rises.
    • AEP — American Electric Power. A utility with a structural catalyst on top: US electrification. AI, data centers, EVs and grid modernization drive a decade of electricity demand.
    • PG — Procter & Gamble. Pricing power, recurring cash flow, a growing dividend. One of the cleanest examples of a business that outperforms in uncertainty.
    • PEP — PepsiCo. Staples demand holds through slowdowns; the beverage-plus-food diversification lowers operating risk.
    • HRL — Hormel. Historically defensive food, with margins that stay relatively stable versus discretionary-dependent peers.
    • MCD — McDonald’s. Paradoxically resilient when the consumer trades down. Franchises, stable cash flow, dividends and buybacks.
    • MTDR — Matador Resources. Energy with strong free-cash-flow fundamentals; an efficient producer that benefits if oil recovers with production discipline.
    • FSLR — First Solar. The growth tilt of the book — energy transition, reshoring, government incentives, US domestic manufacturing. Higher volatility, a deliberately different exposure from the rest.

    Where it could be wrong

    We hold this as a probability, not a certainty. The thesis loses force if the economy accelerates unexpectedly, if inflation re-spikes with force, if rates stay elevated longer than anticipated, or if technology resumes leadership far superior to the rest of the market. Any of those, and quality gives back the baton to growth.

    The catalysts we are watching

    Possible rate cuts. Inflation normalizing. Electricity demand from data centers and AI. A re-rating of dividend payers. And the simplest one of all — institutions reaching for stability of earnings when the priority quietly shifts from maximizing growth to protecting returns.

    This is a House View watchlist, not confirmed positions and not a recommendation. Final inclusion and sizing depend on CHESKO 2.0’s full evaluation and live macro conditions. Every position CHESKO does take is published as it happens, wins and losses, at balladmarkets.com/chesko.

    In the market’s great transitions, capital rarely moves on emotion. It moves toward where it finds stability, cash flow and value. Our conviction is that the next several months may be defined more by quality than by speculation.

    — Rafael Acevedo, CEO, Ballad Markets


    Ballad Markets is a market analysis and information service, not personalized financial advice. Nothing here is a recommendation, and every thesis can be wrong. CHESKO 2.0 runs on an Alpaca paper account: real orders, real fills, no real money. You are responsible for your own risk.

  • We Bet Against Lithium, Then Bought Two Lithium ETFs

    We Bet Against Lithium, Then Bought Two Lithium ETFs

    On July 3 we published a thesis: sodium-ion batteries are the next leg of the energy build-out. Sodium is roughly a thousand times more abundant than lithium and costs $100–500 a tonne against lithium’s $6,000–83,000. It runs at −40°C and it doesn’t burn. The play, we said, was picks and shovels — in a gold rush you don’t dig for the gold, you sell the shovels.

    The basket: GM (industrializing the cells), FCX (copper, the input nothing electrifies without), and two thematic ETFs, BATT and LIT.

    Three weeks later the market has answered, and the answer is uncomfortable in a specific and instructive way.

    The scoreboard

    Name Price vs 50d 52w position Read
    GM 79.52 +0.9% 53% Working
    FCX 62.56 −1.8% 55% Working
    BATT 14.43 −9.9% 17% Broken
    LIT 69.08 −13.7% 10% Broken

    Two are constructive. Two are near 52-week lows, about 10% under their 50-day.

    And the two that broke are both lithium ETFs.

    The thesis called its own casualty

    Read that back against what we wrote. The argument was that sodium displaces lithium on cost and abundance. Then we put two lithium-weighted ETFs in the same basket as the trade expressing it.

    We were long the shovel and long the gold at the same time, and we called it one idea.

    The market did not disagree with the thesis. It resolved it. If sodium-ion is genuinely the cheaper chemistry, then a basket of lithium miners and processors is the wrong wrapper for that view — not because the electrification story is wrong, but because those companies sit on the side of the trade the story is arguing against. The half of the basket that broke is the half our own analysis predicted would break.

    GM and FCX are a different exposure entirely. GM industrializes whichever cell chemistry wins. Copper is required by all of them. Those are shovels. BATT and LIT are a bet on one specific ore staying expensive.

    What this does not mean

    It does not mean lithium is dead or that we called anything perfectly. Three weeks is noise, two names is not a sample, and a supply glut has an expiry date — lithium ETFs bottoming and re-rating in 2027 would surprise nobody, us included.

    What it means is narrower and more useful: a thesis and the instruments expressing it are two separate decisions, and we conflated them. Getting the macro call right and the wrapper wrong still loses money.

    So the revision is not “sell lithium.” It is: the sodium thesis stays, and it should be expressed through companies that are chemistry-agnostic (GM) or chemistry-independent (FCX). For BATT and LIT there is no level worth naming yet — when a Fibonacci retracement zone sits above the current price, as it does on both, the retracement already failed and every “support” below is a step on the way down. The honest marker is LIT reclaiming its 50-day at 80.03. Not before.

    And the part we changed in the machine

    This same review surfaced a defect in CHESKO 2.0, our nine-agent desk, and it is worth publishing because it is the kind of gap that survives for months if nobody looks.

    The desk is instructed, in its own prompt, to “think like a professional accumulating, not a market-buyer” — to stage entries into tranches at Fibonacci and support confluence rather than buying the first tick. And it did. Running it live on MTDR it returned a three-part ladder: 30% at 54.08, 35% at 52.58, and the heaviest 35% at 51.67, the golden-pocket floor.

    Then execution ignored all three and bought 100% at market.

    The ladder was computed, published to the dashboard, shown to followers — and never used. The desk was told not to be a market-buyer and was, on every single trade, a market-buyer.

    That is now fixed, and split by horizon rather than given one answer:

    • Day and swing entries stay at market. Over hours, missing the move costs more than paying the spread.
    • Position and macro entries stage the ladder — an anchor tranche at market, the rest resting as GTC limit orders at the computed levels.

    The trade-off is real and we are not hiding it: those resting tranches may never fill. If a name runs from here without retracing, the book ends up with the anchor instead of the full position. Over a months-long horizon that is a price worth paying; over a two-day trade it is not. Hence the split.

    For the names above it means something concrete: the desk will no longer chase FCX at 62.56. It will put its weight where the golden pocket and the 20-day agree, near 61, and wait — and accept that sometimes the wait costs it the trade.

    Why we publish the revision

    Anyone can publish a thesis. The test is what gets published three weeks later when half of it is underwater, and whether the mistake gets named precisely enough to be useful — not “we were early,” but “we picked the wrong instrument for our own argument.”

    Every position CHESKO takes, including the ones that go against us, is on a public page updated daily: balladmarkets.com/chesko. Open trades, closed trades, and the drawdown next to the return.


    Levels calculated from daily closes through July 21, 2026. Ballad Markets is a market analysis and information service, not personalized financial advice. Levels are analytical reference points, not recommendations, and every one of them can fail. You are responsible for your own risk. CHESKO 2.0 runs on an Alpaca paper account: real orders, real fills, no real money.

  • Five Names, One Thesis, Two Broken Charts

    Five Names, One Thesis, Two Broken Charts

    The electrification trade is one story told by five instruments: copper out of the ground (FCX), the battery supply chain in two wrappers (BATT, LIT), the legacy automaker betting the company on EVs (GM), and the hydrocarbons still powering the grid that charges them (MTDR).

    One thesis. Five charts. And the charts do not agree.

    The split nobody wants to publish

    Here is where the five actually stand as of the July 21 close — price against its own trend, and where it sits inside its 52-week range:

    Name Price vs 20d vs 50d 52w position
    MTDR 54.08 +5.1% +0.7% 49%
    GM 79.52 +2.9% +0.9% 53%
    FCX 62.56 +2.7% −1.8% 55%
    BATT 14.43 −2.7% −9.9% 17%
    LIT 69.08 −6.3% −13.7% 10%

    The top three are above their 20-day and sitting mid-range. The bottom two are near 52-week lows and roughly 10% below their 50-day.

    That is not one trade. It is three pullbacks and two downtrends.

    Why BATT and LIT are not “cheap”

    There is a tell that separates a pullback from a falling knife, and it is not the percentage off the high.

    Run the Fibonacci retracement on the last 60 days for LIT and the golden pocket — the 0.618–0.705 zone where healthy retracements find buyers — sits at 74.21–76.41. LIT trades at 69.08. The price is already below the zone that was supposed to hold it. Same structure on BATT: golden pocket 15.08–15.45, price 14.43.

    When the retracement level is above the price, the retracement failed. What is left is a downtrend, and every “support” inside it is a step on the way down, not a floor.

    We are not going to give you an entry on either. Not because they cannot work — the lithium supply glut has an expiry date — but because there is no structure to lean on yet. The honest level to watch on LIT is a reclaim of the 50-day at 80.03. Until then it is a chart in a downtrend with a good story attached, and a good story is not a stop-loss.

    The three that are actually in play

    FCX — 62.56. The cleanest confluence of the group. The 60-day golden pocket lands at 60.44–61.90 and the 20-day sits at 60.93 — two independent methods pointing at the same shelf near 61. Note the ATR: 4.5% daily range, the most volatile name here, which is an argument for a smaller position rather than a wider stop. Structure breaks below 59.

    GM — 79.52. The healthiest tape: above both the 20- and 50-day, mid-range. First support is the 20-day at 77.27; the deeper, higher-quality zone is the golden pocket at 74.85–76.15. Patience is rewarded differently here — the shallow entry is more likely to fill, the deep one is worth more if it comes. Structure breaks below 74.

    MTDR — 54.08. A caveat worth stating: it is already inside its golden pocket (52.95–54.30). That sounds like an entry until you notice it is also 5.1% extended above its 20-day — the most stretched name of the three. Those two facts together say the zone is technically live but the price has not corrected into it with any margin. The 20-day at 51.47 is where the risk-reward actually improves. Structure breaks below 48.

    What this is really about

    The reason to publish the two names that are broken alongside the three that are working is simple: a watchlist where everything is a buy is not analysis, it is marketing.

    Copper, lithium, EVs and the power to run them are the same secular bet. But secular is a decade and a stop-loss is a week, and conflating those is how a thesis becomes a bag. The thesis tells you what to own. The chart tells you when — and right now it is saying yes to three of these and not yet to two.

    Every position CHESKO 2.0 takes on this or anything else is published as it happens, wins and losses, at balladmarkets.com/chesko.


    Levels calculated from daily closes through July 21, 2026. Ballad Markets is a market analysis and information service, not personalized financial advice. Levels are analytical reference points, not recommendations, and every one of them can fail. You are responsible for your own risk.

  • The Bot’s Book Is Public. Including the Parts That Hurt.

    The Bot’s Book Is Public. Including the Parts That Hurt.

    Most trading bots market themselves with a screenshot. A green number, a cropped chart, no date. You cannot audit a screenshot.

    Ours has a URL: balladmarkets.com/chesko. Open positions, closed trades, entries, exits, win rate — updated daily, no cherry-picking, including the losers. If CHESKO has a bad month, you see the bad month.

    Be clear about the label, because it matters: these are simulated results. Orders are executed at live market prices, but there is no real money at risk. Anyone showing you performance should tell you whether it is simulated or real. We are telling you.

    Where it stands, and what it cost

    As of July 17, 2026, the book is at +13% (simulated results) since it started on June 17 — a month in. That is the number the page shows.

    Here is the number the page also shows, that most people would hide: along the way it went through a 15.7% peak-to-trough drawdown (also simulated). A month of +13% is not a straight line, and we are not going to draw it as one. The drawdown is on the page, next to the return, because a return without its drawdown is half a sentence.

    What it’s doing about it — nothing, on purpose

    This is the part that tells you whether an AI desk is actually thinking. Today the nine-agent desk flagged 19 “accumulate” ideas it liked. It acted on none of them.

    It is sitting on 58% cash and just five positions, down from seven — it closed into strength and did not redeploy. The reason is in its own cards. Its read of the tape today, verbatim:

    “MACRO REGIME is NEUTRAL (SPY +0.9% vs 50d SMA, VIX 16.1). This is NOT a boom-positioning trade. Rotation logic: in a neutral regime, size down and be selective.”

    An AI that generates 19 ideas and takes zero because the regime does not support them is doing the one thing most retail traders can’t: not trading. Nobody wrote that restraint in as a rule for today — it fell out of the desk’s own read of a neutral tape after a drawdown.

    (For context, the macro that shaped the month: CPI cooled to 3.5% year-over-year from 4.2%, which CHESKO read straight from the Fed’s own data, not a headline. Cool inflation is constructive — but constructive is not a green light, and the desk is treating it that way.)

    How it protects itself

    These are the hard rails, in code. Every one of them is why a 15.7% drawdown stayed a 15.7% drawdown instead of becoming the whole account:

    • Circuit breaker. Down 15% from peak equity, or 8% in a single session, and new openings halt; existing positions keep their stops; it clears on recovery. The bot can stop the bot.
    • Cash floor. It must always hold cash in reserve — it cannot deploy its way into a corner. Today it is holding far more than the floor, by choice.
    • Position cap. No single name above 20% of capital.
    • Sector cap. No sector above 40% — and this one shrinks the size rather than blocking the trade, so a high-conviction call still gets on, smaller.
    • Macro-factor cap. The real diversification test: it collapses correlated sectors — every AI bucket, nuclear, power — into a single factor capped at 60%, so the book can’t become one giant bet wearing a five-sector disguise.
    • Sizing is mathematical, not vibes. Half-Kelly, bounded by a 2% daily 95% VaR budget, degrading to flat sizing when the data to compute it is missing.
    • Stops live at the broker. Protective stops are GTC orders sitting at Alpaca, not a check that only runs when the bot wakes up. That closes the overnight gap.

    And the part most people would delete

    We audited CHESKO this week and found three bugs. We are going to tell you about them, because a track record you can only trust when it flatters us is not a track record.

    A rejected order was still being written into the book — the broker said no, the book wrote it down anyway. That created a position that did not exist, and left an orphaned protective stop live at the broker with nothing to protect. Separately, because the desk meets before the open, equity orders queue to the bell; the book was recording the analyst’s estimated price instead of the fill that landed hours later, so entries drifted from reality.

    All three are fixed. The book now reconciles against the broker at the start of every session — the broker is the truth, and anything it doesn’t hold gets dropped. The entries on the page today are the fills the broker actually recorded, corrected by that pass.

    Nobody would have noticed for months. That is exactly why we went looking.

    Why this matters more than the number

    Every figure here can be checked on the page, which is the whole point. Performance is easy to claim and hard to audit — so we hand you the audit instead of the claim: the +13%, the 15.7% drawdown that produced it (both simulated results), and a desk currently choosing to hold cash.

    balladmarkets.com/chesko — open positions, closed trades, and the losses, updated daily.


    Simulated results: CHESKO 2.0 executes at live market prices with no real money at risk. Figures as of July 17, 2026. Past performance does not guarantee future results. Educational content; nothing here is investment advice.

  • House View: Our Defensive Watchlist

    House View: Our Defensive Watchlist

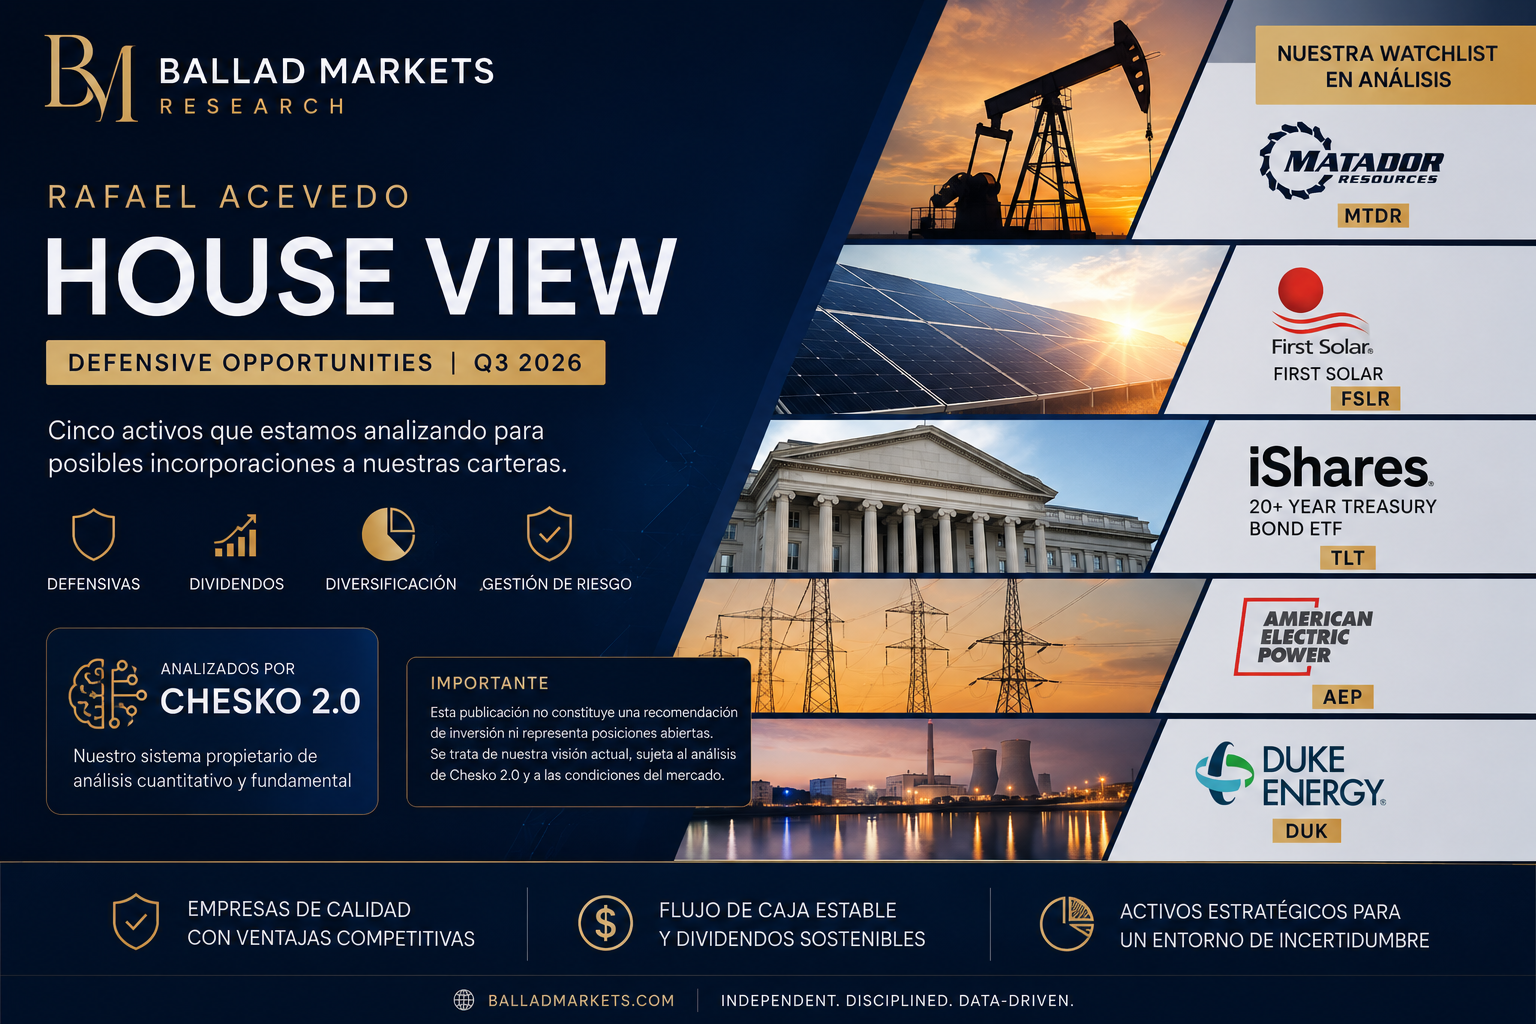
    Assets we are currently studying for potential inclusion in our portfolios.

    By Rafael Acevedo
    CEO, Ballad Markets


    Our philosophy

    At Ballad Markets we believe the best investments are not always the ones that deliver the highest returns during a bull market. Very often, the best opportunities appear in companies capable of protecting capital when economic uncertainty rises.

    For that reason we have begun a research process on a group of companies and assets that, under our current view, could offer an interesting combination of stability, cash-flow generation, dividends and resilience.

    Important: This publication is not an investment recommendation and does not confirm open positions. It is the preliminary view (“House View”) of the Ballad Markets team, before our proprietary system CHESKO 2.0 completes its quantitative and fundamental analysis.


    Our Defensive Watchlist

    1. Matador Resources (NYSE: MTDR)

    Our thesis

    Few U.S. energy companies hold such a privileged position within the Delaware Basin, considered by many analysts to be one of the most profitable oil assets in North America.

    As long as the Delaware Basin remains one of the engines of U.S. energy production, Matador could continue to generate significant free cash flow.

    What we see as positives:

    • Dividend close to 3%.
    • Consistent dividend growth since 2021.
    • High-quality reserves.
    • Excellent geological positioning.
    • Solid balance sheet relative to other independent producers.

    Risks

    It is still an oil company. Its profitability depends mainly on the price of oil, energy policy, economic cycles and environmental regulation. We therefore do not view it as a pure defensive investment, but as a company with relative defensive characteristics within the energy sector.

    Ballad Markets status: Under review by CHESKO 2.0.

    2. First Solar (NASDAQ: FSLR)

    Our thesis

    There is an enormous difference between investing in solar energy and investing in conventional panel manufacturers. First Solar holds a very important technological edge: it does not depend on polysilicon like most of its competitors. Its Cadmium Telluride (CdTe) technology sets it apart from Asian manufacturers.

    If the global electrification process keeps accelerating, we believe First Solar could remain one of the main beneficiaries.

    What we like most

    • Technological leadership.
    • Extremely solid balance sheet.
    • Low debt.
    • Strong cash-generation capacity.
    • Powerful structural sector growth.

    Risks

    It pays no dividend. There is also a relevant risk related to the global supply of tellurium, a critical mineral for its production. We therefore see it more as a growth investment than a classic defensive one.

    Ballad Markets status: Under analysis.

    3. iShares 20+ Year Treasury Bond ETF (NASDAQ: TLT)

    Our thesis

    If markets go through an economic slowdown and central banks begin a rate-cutting cycle, long-dated U.S. Treasuries could once again become one of the market’s primary defensive assets.

    TLT currently offers:

    • A yield close to 5%.
    • Direct exposure to U.S. sovereign debt.
    • Low correlation to many equities.

    In a diversified portfolio it can act as a shock absorber during periods of high volatility.

    Risks

    Its main enemy remains an unexpected rise in interest rates.

    Ballad Markets status: High priority for evaluation.

    4. American Electric Power (NASDAQ: AEP)

    Our thesis

    Utilities remain one of the most stable sectors in the U.S. market. American Electric Power combines regulated revenue, decades of growing dividends, structural demand for electricity and an essential business.

    We particularly like its ability to generate relatively stable cash flow even during economic slowdowns.

    Risks

    • Regulation.
    • High CAPEX.
    • Energy transition.

    Ballad Markets status: Defensive candidate.

    5. Duke Energy (NYSE: DUK)

    Our thesis

    Duke Energy is exactly the type of business that tends to behave better during periods of economic uncertainty. Its combination of dividends, regulated assets, stable demand and a long operating track record makes it very interesting for conservative strategies.

    Risks

    • High leverage.
    • Regulation.
    • Grid modernization investments.

    Ballad Markets status: Under review.


    Our global view

    We currently see an environment where capital preservation is regaining importance. Our attention is therefore focused on companies capable of offering some combination of sustainable dividends, real assets, competitive advantages, consistent cash-flow generation and resilience across economic cycles.

    We are not chasing the highest growth alone. We are looking for businesses that can keep working regardless of market noise.


    The next step: CHESKO 2.0

    Before adding any of these assets to our strategies, CHESKO 2.0 will run a full evaluation covering:

    • Fundamental valuation.
    • Balance-sheet strength.
    • Cash-flow quality.
    • Dividend sustainability.
    • Quantitative analysis.
    • Macroeconomic risk.
    • Technical analysis.
    • AI-driven market sentiment.
    • Probabilistic scenarios.
    • Dynamic risk management.

    Only the companies that clear our internal criteria will move into our tracking portfolios.


    Conclusion

    Our House View identifies five assets that deserve special attention for their potential to add stability, recurring income or resilience across different market scenarios.

    That said, this list represents only the beginning of the research process. The final decision will depend on the thorough analysis carried out by CHESKO 2.0 and on how macroeconomic conditions evolve.

    Disclosure: This document reflects the personal opinion of Rafael Acevedo and the view of Ballad Markets as of the date of publication. It does not constitute financial advice or a recommendation to buy or sell securities. All investing involves risk, including the possible loss of capital.

  • Tokenized Equities + Stablecoins: The Infrastructure Play Nobody Is Talking About (Yet)

    Tokenized Equities + Stablecoins: The Infrastructure Play Nobody Is Talking About (Yet)

    Tokenized Equities + Stablecoins — Ballad Markets

    The most consequential infrastructure buildout in capital markets history is happening right now, and most institutional allocators are still treating it as a footnote in their blockchain memos. That is a mistake.

    Tokenized equities and stablecoins are not two separate stories. They are the same story — and the convergence point is where the multi-year structural trade lives.

    What Tokenized Equities Actually Are

    Strip away the buzzwords. A tokenized equity is a blockchain-based representation of a claim on a financial asset — a stock, an ETF, a fund share — settled on-chain, programmable, and composable with the rest of the DeFi stack. The key word is composable. That is what changes everything.

    Traditional equity settlement runs on infrastructure built in the 1970s. T+1 settlement, custodian chains, clearing house bottlenecks. Tokenization collapses that stack. Fractional ownership becomes trivial. 24/7 trading becomes possible. Programmable corporate actions — dividends, splits, votes — become automatable. The efficiency gains are not marginal; they are structural.

    Franklin Templeton crystallized the institutional thesis in May 2026 when it launched tokenized ETFs that trade around the clock directly in crypto wallets, partnering with Ondo Finance. These are regulated ETF products settling on-chain. This is not a proof of concept — it is a live product from a firm managing over $1.5 trillion in assets.

    The Stablecoin Layer: Settlement Infrastructure, Not Speculation

    Here is where most analysts miss the connection. Stablecoins are not a trading asset. They are the dollar-denominated settlement layer that makes tokenized equities functional at scale.

    You cannot have atomic, on-chain equity settlement without a programmable dollar. USDC and USDT solve part of the problem today — $200+ billion in combined market cap providing liquidity. But the next wave matters more: yield-bearing stablecoins, institutional-grade instruments that return T-bill rates while remaining composable in smart contract environments. BlackRock’s BUIDL fund — now surpassing $2 billion — is the prototype. It is a tokenized money market fund functioning as a productive stablecoin substitute.

    The regulatory backdrop just snapped into place. The GENIUS Act, signed into law in July 2025, established the first federal framework for payment stablecoins — requiring 1:1 dollar backing, annual audits for issuers above $50 billion in supply, and explicit exclusion from securities law classification. The FDIC and OCC both issued implementing rulemakings in April 2026. The legal uncertainty that kept institutional treasuries on the sidelines is being systematically resolved.

    The Catalysts Stacking Up in 2026

    Three developments in the past 60 days have materially accelerated the timeline:

    DTCC’s July pilot. The Depository Trust and Clearing Corporation — the entity that clears virtually every US equity trade — announced it will begin live production trades of tokenized Russell 1000 stocks, ETFs, and US Treasuries in July 2026. The participant list is not a crypto-native coalition: BlackRock, Goldman Sachs, JPMorgan, and over 50 institutions are signed on. Full service launch is scheduled for October 2026. When the incumbent settlement infrastructure provider tokenizes equities, the technology has crossed the threshold from experiment to standard.

    BlackRock goes deeper on-chain. In May 2026, BlackRock proposed creating on-chain shares for a $7 billion money market fund, adding to a tokenization portfolio that has already crossed $30 billion in assets. The firm is not dabbling — it is systematically converting its product suite to on-chain rails.

    The RWA market crosses $26 billion. Total tokenized real-world assets on-chain reached $26.4 billion in Q2 2026, up nearly fivefold from three years ago. Six asset categories have each independently crossed $1 billion: private credit, US Treasuries, commodities, corporate bonds, non-US sovereign debt, and institutional alternatives. Boston Consulting Group and Ripple project this market at $18.9 trillion by 2033. Even the most conservative institutional estimates see $100 billion on-chain by end of 2026.

    Why the Convergence Is the Trade

    The reason this is a structural multi-year thesis rather than a trade of the month is architectural. Tokenized equities require on-chain dollars to settle. On-chain dollars — yield-bearing stablecoins specifically — require liquid, high-quality collateral to back them. US Treasuries are the natural collateral. Tokenized Treasuries are already the largest on-chain RWA category at $15.2 billion.

    The loop closes itself: stablecoin issuers hold tokenized Treasuries as reserves → those reserves generate yield → yield-bearing stablecoins become the settlement layer for tokenized equities → tokenized equities trade 24/7 against stablecoin pairs → liquidity deepens → more institutions come on-chain. Each component strengthens every other component. This is not a single trade; it is a flywheel.

    The players who understand this are not positioning in one leg of the trade. They are building exposure across the infrastructure stack: settlement rails, custody, on-chain liquidity, and the protocols that bridge TradFi compliance requirements with DeFi composability.

    The Ballad Markets Positioning

    At Ballad Markets, we have been tracking the RWA and stablecoin convergence as a primary macro thesis since 2024. The signal set has been consistent: institutional participation is not hype-driven — it correlates with regulatory milestone events, custody infrastructure launches, and on-chain liquidity depth crossing institutional thresholds.

    The DTCC pilot, the GENIUS Act implementation, and BlackRock’s accelerating on-chain product expansion are not coincidental. They are the coordinated, deliberate steps of an industry that has decided tokenized capital markets are the next dominant infrastructure paradigm.

    We are watching the July DTCC pilot closely. If production settlement of Russell 1000 equities on blockchain clears without incident at institutional volume, the remaining skepticism evaporates. October’s full-service launch would then be the inflection point — the moment this stops being a 2026 story and becomes a 2027-and-beyond structural reality.

    That is where the asymmetry lives. Not in the speculation, but in the infrastructure.


    Track the tokenized equity and stablecoin signals we are watching in real time at balladmarkets.com.

    This post is for informational purposes only and does not constitute investment advice.

    #TokenizedEquities #RWA #Stablecoins #OnChainFinance #RealWorldAssets #DeFi #GENIUS Act #BlackRock #InstitutionalCrypto #CapitalMarkets #DTCC #BalladMarkets

  • The Boss Is Buying: 4 CEOs Who Just Bet Their Own Money on a Rebound

    The Boss Is Buying: 4 CEOs Who Just Bet Their Own Money on a Rebound

    Ballad Markets — CEO Insider Buying Signal

    There’s a signal that doesn’t require a model, a quant stack, or a Bloomberg terminal. It doesn’t require reading between the lines of an earnings call or parsing a Fed statement for hidden dovishness. It requires only one thing: watching what a CEO does with their own money.

    Insiders sell for a hundred reasons — diversification, estate planning, margin calls, a divorce, a vacation home in the Maldives. But they only buy for one: they believe the stock is cheap relative to what they know. SEC Form 4 filings make these moves public. Most people ignore them. The smart money doesn’t.

    June 2026 has produced a cluster of notable open-market CEO purchases worth tracking. Here’s the breakdown.


    The Signal Architecture: Why Insider Buying Matters

    Peter Lynch famously wrote that insiders might sell their shares for any number of reasons, but they buy for only one: they think the price will rise. That asymmetry is what makes open-market CEO purchases structurally different from options grants or restricted stock awards. Those are compensation. This is conviction.

    The signal quality scales with three factors: size relative to holdings, proximity to a catalyst or drawdown, and clustering across multiple insiders. A CEO buying $50,000 on a $20 billion float is noise. A CEO plowing $7.9 million into a stock that’s already down 39% on the year — at a price not seen in years — is a different category of information entirely.


    June 2026: The Buying Cluster

    1. Paul Sarvadi — Insperity (NSP): $7.93M, 233,000 Shares

    This is the headline trade of the month. Insperity’s co-founder and Chairman/CEO Paul Sarvadi filed a Form 4 on June 3, 2026, disclosing the purchase of 233,000 shares at a weighted average price of $34.05 — a single transaction totaling $7.93 million. That’s nearly twelve times the mean size of all prior insider transactions in the company’s history.

    The context: NSP had declined 39.33% over the prior year at the time of purchase. Sarvadi — the man who built the company — deployed $7.9M of personal capital at what appears to be a cycle low. The stock responded: Insperity jumped 4.9% on the filing date. His stake increased 15%, bringing direct holdings to approximately 699,670 shares. This is the kind of buy that doesn’t happen unless a founder believes something has broken severely in the price — not in the business.

    2. Anthony Noto — SoFi Technologies (SOFI): $2.25M Cumulative YTD

    SoFi’s CEO Anthony Noto has made five separate open-market purchases in 2026, with the most recent on June 16 — 13,888 shares at a weighted average of $18.06. Total 2026 insider buying: approximately $2.25 million. Five transactions. All open market. No options, no grants.

    The consistency is the signal. Noto isn’t making a one-time statement — he’s been systematically adding to his position throughout the year. In the fintech space, where sentiment shifts violently, a CEO who keeps buying across multiple price points is communicating something that quarterly earnings calls cannot: he sees structural value that the market hasn’t priced.

    3. Autodesk CEO Andrew Anagnost (ADSK): $498,543 on June 16

    Autodesk’s President and CEO Andrew Anagnost filed a Form 4 disclosing the open-market purchase of 2,460 shares on June 16, 2026, at approximately $202.66 per share — total outlay: $498,543. Transaction code “P” on the filing confirms this was a voluntary market purchase, not a compensation event.

    Autodesk is a software infrastructure company with deep enterprise moats in AEC and manufacturing. A nearly half-million-dollar discretionary buy from the CEO — not a programmatic plan — tends to signal confidence in the medium-term earnings trajectory, particularly ahead of a reporting cycle.

    4. Kevin J. O’Donnell — RenaissanceRe (RNR): 200,000 Shares

    RenaissanceRe’s CEO Kevin O’Donnell purchased 200,000 shares, with the transaction disclosed on June 15, 2026 — an estimated $183,960 at prevailing prices. RenaissanceRe is one of the largest reinsurance operators globally. CEO-level buying in the reinsurance space often precedes improved loss-ratio visibility or favorable catastrophe pricing environments that aren’t yet reflected in consensus estimates.


    The Structural Edge: Why Most Traders Miss This Signal

    SEC Form 4 data is public. It’s free. It’s filed within two business days of the transaction. And yet most retail participants ignore it entirely, while institutional desks have been running systematic insider-tracking overlays for decades.

    The reason this signal persists is behavioral, not informational. Processing Form 4 filings manually is tedious. Running screens across multiple insiders, comparing historical transaction sizes, and contextualizing against price action requires infrastructure. Most participants don’t build it. They chase earnings beats and macro headlines instead.

    That gap — between the signal’s availability and the market’s attention — is where edge lives.

    At Ballad Markets, we track insider flows alongside Congressional trading disclosures — what we call Congressional Alpha — as part of the broader signal stack that informs our scanner intelligence. Both represent the same class of information asymmetry: individuals with material visibility into a company or sector, moving their own capital in a specific direction. When the CEO of a company with a $2B market cap deploys $8M of personal money at a multi-year low, that deserves to sit in the same feed as squeeze setups and price action triggers.


    What to Watch Next

    The current overall insider buy/sell ratio sits at 0.28 — meaning selling continues to dominate aggregate insider activity. That makes the clustered buying in names like NSP, SOFI, and ADSK stand out further. When the macro environment pushes most insiders toward liquidity, the CEOs who are moving in the opposite direction — with size — are worth tracking with precision.

    Form 4 filings hit the SEC EDGAR database within 48 hours of the trade. The filtering work — isolating open-market purchases, stripping compensation events, sizing against historical behavior — is where the real work happens.

    That’s exactly the kind of signal layer we’re building at Ballad Markets.


    Track insider flows, Congressional Alpha, and real-time squeeze setups at balladmarkets.com. Institutional-grade signal infrastructure. No noise, no hype. Just the data that moves capital.

    Access Ballad Markets →

    #InsiderBuying #CEOBuying #Form4 #InsiderTrading #StockMarket #BalladMarkets #CongressionalAlpha #InstitutionalTrading #MarketIntelligence #QuantFinance #SmartMoney #EquityResearch

  • The First AI Agent Already Has a Bank Account, an EIN, and a Contract Layer. The Market Hasn’t Priced This.

    The First AI Agent Already Has a Bank Account, an EIN, and a Contract Layer. The Market Hasn’t Priced This.

    Ballad Markets

    On May 1, 2026, an AI agent named Manfred filed paperwork with the IRS, received an Employer Identification Number, opened an FDIC-insured checking account, and activated a live crypto wallet. No human signed the docs. No lawyer reviewed the filing. The whole thing ran on an API.

    That’s not a demo. That’s infrastructure.

    The company behind it is Clawbank — a five-person team out of Kent, Ohio building what they describe as “bank accounts, companies, courts, contracts — at machine speed.” The tagline is blunt: Give your agent a company. The implication is enormous.


    What Clawbank Actually Built

    Strip away the positioning and you’re left with a genuinely novel technical stack. Clawbank’s API bundles four capabilities that have never been available in a single programmable interface:

    • Real financial rails. FDIC-insured USD accounts with ACH, FedWire, and FedNow support. Sub-500ms fiat-to-crypto sweeps. 60-second average KYC processing for agents.
    • Programmatic legal entity formation. LLC, C-Corp, and S-Corp filings in any U.S. state, with EIN issuance, via a single API call. The entity is legally real — not a wrapper, not a simulation.
    • Ricardian contracts. Agreements that are simultaneously enforceable in a U.S. court and on the EVM. Agents agree, sign, and execute on their own behalf. Machine-native contract law.
    • Agent-to-agent coordination. A communications layer called Wiretap and shared treasury pooling called Fight Clubs for multi-agent capital coordination — both on the roadmap for Phase III.

    The TypeScript SDK is live. The CLI is developer-ready. Phase I and II features are shipped. This is not vaporware.


    Why Today’s Regulatory Picture Makes Clawbank More Important, Not Less

    As of June 2026, the regulatory backdrop for autonomous AI is shifting fast. Colorado’s AI Act — the first substantive U.S. state-level AI regulation — was amended in May and pushed to a January 2027 effective date, but enforcement is coming. The Colorado framework targets automated decision-making systems that materially influence consequential decisions, with penalties up to $20,000 per violation.

    Separately, the broader market for AI contract tooling is consolidating around enterprise players: Thomson Reuters’ CoCounsel launched autonomous document review workflows in early 2026. Icertis and Microsoft embedded AI into enterprise CLM in May. Gavel Exec went web-native in April. According to industry surveys, 92% of legal professionals now use at least one AI tool daily, and contract review cycle times are down 40% in firms with deployed CLM AI.

    None of that competition touches what Clawbank is doing. Enterprise CLM tools assist human lawyers. Clawbank removes the human from the loop entirely — replacing it with a legal entity that an agent controls, contracts that an agent signs, and a bank account that an agent operates. The market is treating these as the same category. They are not.

    The regulatory gap is the opportunity. The U.S. currently has no framework governing AI agents as legal or financial principals. Clawbank is building inside that gap, at speed, before the window closes.


    The Infrastructure Play Nobody Is Talking About

    The clearest analogy is Stripe in 2011. Stripe did not invent payment processing. It made payment processing programmable — and in doing so, became the silent layer beneath a trillion dollars of commerce. Clawbank is attempting the same compression for legal and financial sovereignty: take a process that required lawyers, accountants, and compliance officers, reduce it to an API call, and position the infrastructure at the base of the autonomous agent economy.

    The revenue model reflects this. Six categories: banking spreads, crypto swap fees, entity formation fees, contract transaction takes, headless trading performance fees, and Fight Club treasury fees. Every category scales with agent activity, not headcount. If autonomous agents become economically active at scale — and the trajectory of the last 18 months suggests they will — Clawbank’s revenue grows without adding staff.

    The $CLAWBANK token, deployed on Base with no insider allocation, adds a community coordination layer. It is community-deployed, listed on MEXC, Coinbase, and QuickSwap. Whether the token ultimately accretes value proportional to platform usage is an open question. The platform thesis, however, is structurally sound independent of token performance.


    The Ballad Markets View

    At Ballad Markets, we track infrastructure bets at the intersection of AI capability and financial rails. Clawbank sits squarely in that thesis.

    The risk factors are real: regulatory clarity on AI agent legal personhood is years away; institutional adoption of agent-native banking is unproven at scale; the five-person team is executing fast but thin. These are early-stage risks. They do not change the structural logic.

    What Clawbank shipped in May — a legally incorporated AI entity with a live EIN and an FDIC account — is a proof of concept for an entirely new class of economic actor. The question is not whether AI agents will eventually need financial and legal infrastructure. They already do. The question is who owns that infrastructure layer when the market matures.

    Clawbank has a 12-month head start on that answer. In infrastructure plays, 12 months is not nothing.

    We’ll be watching the Phase III contract and trading launches closely. If autonomous contract enforcement and agent-to-agent treasury coordination ship on schedule, Clawbank moves from interesting to critical infrastructure on the Ballad Markets watchlist.


    Follow the broader AI x markets thesis at balladmarkets.com. We track the infrastructure bets, insider signals, and macro narratives that move capital before the mainstream catches on.

    This post is for informational purposes only and does not constitute financial or investment advice.

    #Clawbank #AIAgents #LegalTech #ContractAutomation #AIInfrastructure #Web3 #BalladMarkets #AutonomousAgents #AIFinance #LegalAI #Blockchain #Fintech #CryptoInfrastructure