Category: Macro

  • The Quiet Rotation Into Quality Has Already Begun

    The Quiet Rotation Into Quality Has Already Begun

    House View · Rafael Acevedo, CEO, Ballad Markets

    The quiet rotation of capital has already begun. You just have not seen it in the headlines yet.

    Look at the portfolio and the pattern is unmistakable: McDonald’s, First Solar, Hormel, Matador, Duke Energy, American Electric Power, Procter & Gamble, PepsiCo. This is not a book built to chase the maximum possible growth in a euphoric market. It is a classic capital-rotation thesis — toward higher quality, stable cash flow, and resilient sectors — the move that historically happens when the economic cycle enters a more mature phase.

    It is not about abandoning risk. It is about changing which kind of risk you take.

    The macro that forces the hand

    The last two years handed the market a specific cocktail: elevated inflation, historically high rates, slowing credit, weaker discretionary consumption, and extremely demanding technology valuations. When those variables appear together, institutional money starts rotating before the move is obvious to retail — not after.

    If the US economy keeps decelerating while the Federal Reserve begins a gradual cutting cycle, the historical evidence is consistent: leadership shifts from high-growth names into defensives, utilities, consumer staples and select energy.

    The historical map

    In the last major rotation cycles — 2000, 2007, 2015, 2018, 2022 — the sectors that best protected capital were the same each time: utilities, consumer staples, traditional energy, food, and dividend aristocrats. Meanwhile growth lost leadership, unprofitable companies corrected hard, and valuations compressed back toward reality.

    The tell is relative performance, and it usually shows up long before the news does. Defensives are showing relative strength versus the S&P 500. Utilities are breaking long-term downtrends. Staples hold cleaner uptrends than the speculative complex.

    Why these eight

    • DUK — Duke Energy. A regulated utility: low beta, high earnings stability, and a bid that grows as rates fall and dividend demand rises.
    • AEP — American Electric Power. A utility with a structural catalyst on top: US electrification. AI, data centers, EVs and grid modernization drive a decade of electricity demand.
    • PG — Procter & Gamble. Pricing power, recurring cash flow, a growing dividend. One of the cleanest examples of a business that outperforms in uncertainty.
    • PEP — PepsiCo. Staples demand holds through slowdowns; the beverage-plus-food diversification lowers operating risk.
    • HRL — Hormel. Historically defensive food, with margins that stay relatively stable versus discretionary-dependent peers.
    • MCD — McDonald’s. Paradoxically resilient when the consumer trades down. Franchises, stable cash flow, dividends and buybacks.
    • MTDR — Matador Resources. Energy with strong free-cash-flow fundamentals; an efficient producer that benefits if oil recovers with production discipline.
    • FSLR — First Solar. The growth tilt of the book — energy transition, reshoring, government incentives, US domestic manufacturing. Higher volatility, a deliberately different exposure from the rest.

    Where it could be wrong

    We hold this as a probability, not a certainty. The thesis loses force if the economy accelerates unexpectedly, if inflation re-spikes with force, if rates stay elevated longer than anticipated, or if technology resumes leadership far superior to the rest of the market. Any of those, and quality gives back the baton to growth.

    The catalysts we are watching

    Possible rate cuts. Inflation normalizing. Electricity demand from data centers and AI. A re-rating of dividend payers. And the simplest one of all — institutions reaching for stability of earnings when the priority quietly shifts from maximizing growth to protecting returns.

    This is a House View watchlist, not confirmed positions and not a recommendation. Final inclusion and sizing depend on CHESKO 2.0’s full evaluation and live macro conditions. Every position CHESKO does take is published as it happens, wins and losses, at balladmarkets.com/chesko.

    In the market’s great transitions, capital rarely moves on emotion. It moves toward where it finds stability, cash flow and value. Our conviction is that the next several months may be defined more by quality than by speculation.

    — Rafael Acevedo, CEO, Ballad Markets


    Ballad Markets is a market analysis and information service, not personalized financial advice. Nothing here is a recommendation, and every thesis can be wrong. CHESKO 2.0 runs on an Alpaca paper account: real orders, real fills, no real money. You are responsible for your own risk.
  • We Bet Against Lithium, Then Bought Two Lithium ETFs

    We Bet Against Lithium, Then Bought Two Lithium ETFs

    On July 3 we published a thesis: sodium-ion batteries are the next leg of the energy build-out. Sodium is roughly a thousand times more abundant than lithium and costs $100–500 a tonne against lithium’s $6,000–83,000. It runs at −40°C and it doesn’t burn. The play, we said, was picks and shovels — in a gold rush you don’t dig for the gold, you sell the shovels.

    The basket: GM (industrializing the cells), FCX (copper, the input nothing electrifies without), and two thematic ETFs, BATT and LIT.

    Three weeks later the market has answered, and the answer is uncomfortable in a specific and instructive way.

    The scoreboard

    Name Price vs 50d 52w position Read
    GM 79.52 +0.9% 53% Working
    FCX 62.56 −1.8% 55% Working
    BATT 14.43 −9.9% 17% Broken
    LIT 69.08 −13.7% 10% Broken

    Two are constructive. Two are near 52-week lows, about 10% under their 50-day.

    And the two that broke are both lithium ETFs.

    The thesis called its own casualty

    Read that back against what we wrote. The argument was that sodium displaces lithium on cost and abundance. Then we put two lithium-weighted ETFs in the same basket as the trade expressing it.

    We were long the shovel and long the gold at the same time, and we called it one idea.

    The market did not disagree with the thesis. It resolved it. If sodium-ion is genuinely the cheaper chemistry, then a basket of lithium miners and processors is the wrong wrapper for that view — not because the electrification story is wrong, but because those companies sit on the side of the trade the story is arguing against. The half of the basket that broke is the half our own analysis predicted would break.

    GM and FCX are a different exposure entirely. GM industrializes whichever cell chemistry wins. Copper is required by all of them. Those are shovels. BATT and LIT are a bet on one specific ore staying expensive.

    What this does not mean

    It does not mean lithium is dead or that we called anything perfectly. Three weeks is noise, two names is not a sample, and a supply glut has an expiry date — lithium ETFs bottoming and re-rating in 2027 would surprise nobody, us included.

    What it means is narrower and more useful: a thesis and the instruments expressing it are two separate decisions, and we conflated them. Getting the macro call right and the wrapper wrong still loses money.

    So the revision is not “sell lithium.” It is: the sodium thesis stays, and it should be expressed through companies that are chemistry-agnostic (GM) or chemistry-independent (FCX). For BATT and LIT there is no level worth naming yet — when a Fibonacci retracement zone sits above the current price, as it does on both, the retracement already failed and every “support” below is a step on the way down. The honest marker is LIT reclaiming its 50-day at 80.03. Not before.

    And the part we changed in the machine

    This same review surfaced a defect in CHESKO 2.0, our nine-agent desk, and it is worth publishing because it is the kind of gap that survives for months if nobody looks.

    The desk is instructed, in its own prompt, to “think like a professional accumulating, not a market-buyer” — to stage entries into tranches at Fibonacci and support confluence rather than buying the first tick. And it did. Running it live on MTDR it returned a three-part ladder: 30% at 54.08, 35% at 52.58, and the heaviest 35% at 51.67, the golden-pocket floor.

    Then execution ignored all three and bought 100% at market.

    The ladder was computed, published to the dashboard, shown to followers — and never used. The desk was told not to be a market-buyer and was, on every single trade, a market-buyer.

    That is now fixed, and split by horizon rather than given one answer:

    • Day and swing entries stay at market. Over hours, missing the move costs more than paying the spread.
    • Position and macro entries stage the ladder — an anchor tranche at market, the rest resting as GTC limit orders at the computed levels.

    The trade-off is real and we are not hiding it: those resting tranches may never fill. If a name runs from here without retracing, the book ends up with the anchor instead of the full position. Over a months-long horizon that is a price worth paying; over a two-day trade it is not. Hence the split.

    For the names above it means something concrete: the desk will no longer chase FCX at 62.56. It will put its weight where the golden pocket and the 20-day agree, near 61, and wait — and accept that sometimes the wait costs it the trade.

    Why we publish the revision

    Anyone can publish a thesis. The test is what gets published three weeks later when half of it is underwater, and whether the mistake gets named precisely enough to be useful — not “we were early,” but “we picked the wrong instrument for our own argument.”

    Every position CHESKO takes, including the ones that go against us, is on a public page updated daily: balladmarkets.com/chesko. Open trades, closed trades, and the drawdown next to the return.


    Levels calculated from daily closes through July 21, 2026. Ballad Markets is a market analysis and information service, not personalized financial advice. Levels are analytical reference points, not recommendations, and every one of them can fail. You are responsible for your own risk. CHESKO 2.0 runs on an Alpaca paper account: real orders, real fills, no real money.
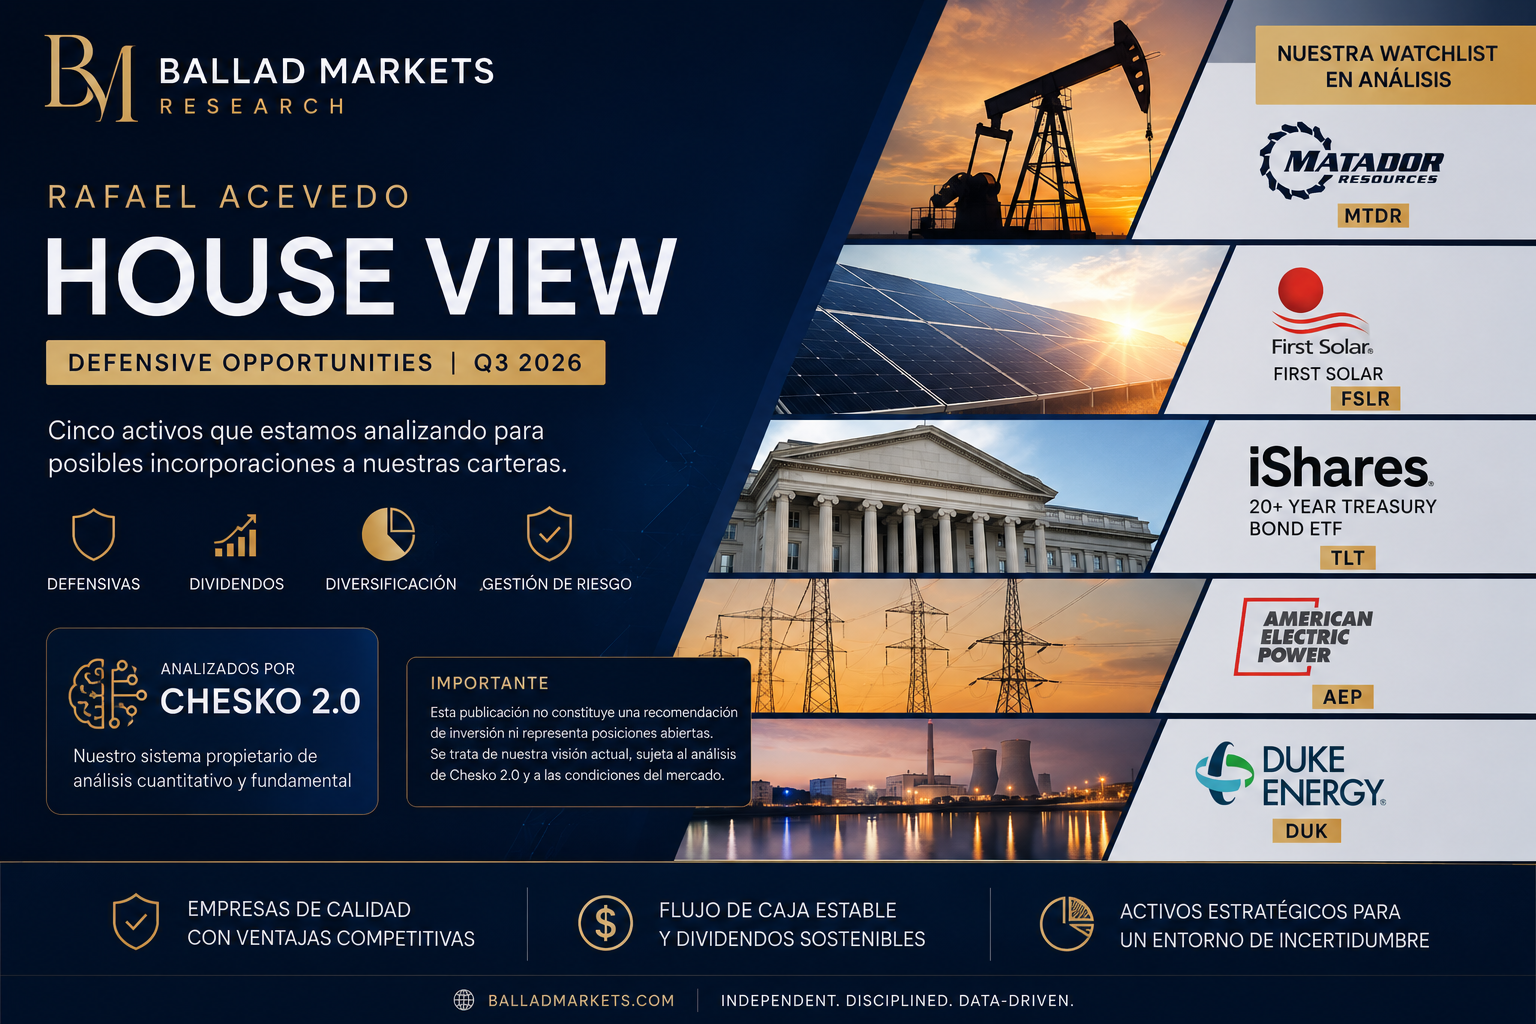
  • House View: Our Defensive Watchlist

    House View: Our Defensive Watchlist

    Assets we are currently studying for potential inclusion in our portfolios.

    By Rafael Acevedo
    CEO, Ballad Markets


    Our philosophy

    At Ballad Markets we believe the best investments are not always the ones that deliver the highest returns during a bull market. Very often, the best opportunities appear in companies capable of protecting capital when economic uncertainty rises.

    For that reason we have begun a research process on a group of companies and assets that, under our current view, could offer an interesting combination of stability, cash-flow generation, dividends and resilience.

    Important: This publication is not an investment recommendation and does not confirm open positions. It is the preliminary view (“House View”) of the Ballad Markets team, before our proprietary system CHESKO 2.0 completes its quantitative and fundamental analysis.


    Our Defensive Watchlist

    1. Matador Resources (NYSE: MTDR)

    Our thesis

    Few U.S. energy companies hold such a privileged position within the Delaware Basin, considered by many analysts to be one of the most profitable oil assets in North America.

    As long as the Delaware Basin remains one of the engines of U.S. energy production, Matador could continue to generate significant free cash flow.

    What we see as positives:

    • Dividend close to 3%.
    • Consistent dividend growth since 2021.
    • High-quality reserves.
    • Excellent geological positioning.
    • Solid balance sheet relative to other independent producers.

    Risks

    It is still an oil company. Its profitability depends mainly on the price of oil, energy policy, economic cycles and environmental regulation. We therefore do not view it as a pure defensive investment, but as a company with relative defensive characteristics within the energy sector.

    Ballad Markets status: Under review by CHESKO 2.0.

    2. First Solar (NASDAQ: FSLR)

    Our thesis

    There is an enormous difference between investing in solar energy and investing in conventional panel manufacturers. First Solar holds a very important technological edge: it does not depend on polysilicon like most of its competitors. Its Cadmium Telluride (CdTe) technology sets it apart from Asian manufacturers.

    If the global electrification process keeps accelerating, we believe First Solar could remain one of the main beneficiaries.

    What we like most

    • Technological leadership.
    • Extremely solid balance sheet.
    • Low debt.
    • Strong cash-generation capacity.
    • Powerful structural sector growth.

    Risks

    It pays no dividend. There is also a relevant risk related to the global supply of tellurium, a critical mineral for its production. We therefore see it more as a growth investment than a classic defensive one.

    Ballad Markets status: Under analysis.

    3. iShares 20+ Year Treasury Bond ETF (NASDAQ: TLT)

    Our thesis

    If markets go through an economic slowdown and central banks begin a rate-cutting cycle, long-dated U.S. Treasuries could once again become one of the market’s primary defensive assets.

    TLT currently offers:

    • A yield close to 5%.
    • Direct exposure to U.S. sovereign debt.
    • Low correlation to many equities.

    In a diversified portfolio it can act as a shock absorber during periods of high volatility.

    Risks

    Its main enemy remains an unexpected rise in interest rates.

    Ballad Markets status: High priority for evaluation.

    4. American Electric Power (NASDAQ: AEP)

    Our thesis

    Utilities remain one of the most stable sectors in the U.S. market. American Electric Power combines regulated revenue, decades of growing dividends, structural demand for electricity and an essential business.

    We particularly like its ability to generate relatively stable cash flow even during economic slowdowns.

    Risks

    • Regulation.
    • High CAPEX.
    • Energy transition.

    Ballad Markets status: Defensive candidate.

    5. Duke Energy (NYSE: DUK)

    Our thesis

    Duke Energy is exactly the type of business that tends to behave better during periods of economic uncertainty. Its combination of dividends, regulated assets, stable demand and a long operating track record makes it very interesting for conservative strategies.

    Risks

    • High leverage.
    • Regulation.
    • Grid modernization investments.

    Ballad Markets status: Under review.


    Our global view

    We currently see an environment where capital preservation is regaining importance. Our attention is therefore focused on companies capable of offering some combination of sustainable dividends, real assets, competitive advantages, consistent cash-flow generation and resilience across economic cycles.

    We are not chasing the highest growth alone. We are looking for businesses that can keep working regardless of market noise.


    The next step: CHESKO 2.0

    Before adding any of these assets to our strategies, CHESKO 2.0 will run a full evaluation covering:

    • Fundamental valuation.
    • Balance-sheet strength.
    • Cash-flow quality.
    • Dividend sustainability.
    • Quantitative analysis.
    • Macroeconomic risk.
    • Technical analysis.
    • AI-driven market sentiment.
    • Probabilistic scenarios.
    • Dynamic risk management.

    Only the companies that clear our internal criteria will move into our tracking portfolios.


    Conclusion

    Our House View identifies five assets that deserve special attention for their potential to add stability, recurring income or resilience across different market scenarios.

    That said, this list represents only the beginning of the research process. The final decision will depend on the thorough analysis carried out by CHESKO 2.0 and on how macroeconomic conditions evolve.

    Disclosure: This document reflects the personal opinion of Rafael Acevedo and the view of Ballad Markets as of the date of publication. It does not constitute financial advice or a recommendation to buy or sell securities. All investing involves risk, including the possible loss of capital.

  • How AI Read the Market Before the Drop — and the Trades That Followed

    How AI Read the Market Before the Drop — and the Trades That Followed

    ABOUT BALLAD MARKETS

    Ballad Markets is an AI-powered trading intelligence platform. It combines macro sentiment analysis (AMAIA), institutional price action pattern detection (Price Action AI), and automated trade execution (DELIA) into a single system — so traders can focus on decisions, not data. balladmarkets.com

    Most traders look at charts first. We do the opposite.

    Before opening a single chart, we check what the market environment is actually saying. Not what we want it to say — what the data says. On the day I am sharing with you, the signal was unmistakable.

    Step 1: Read the Environment First (AMAIA)

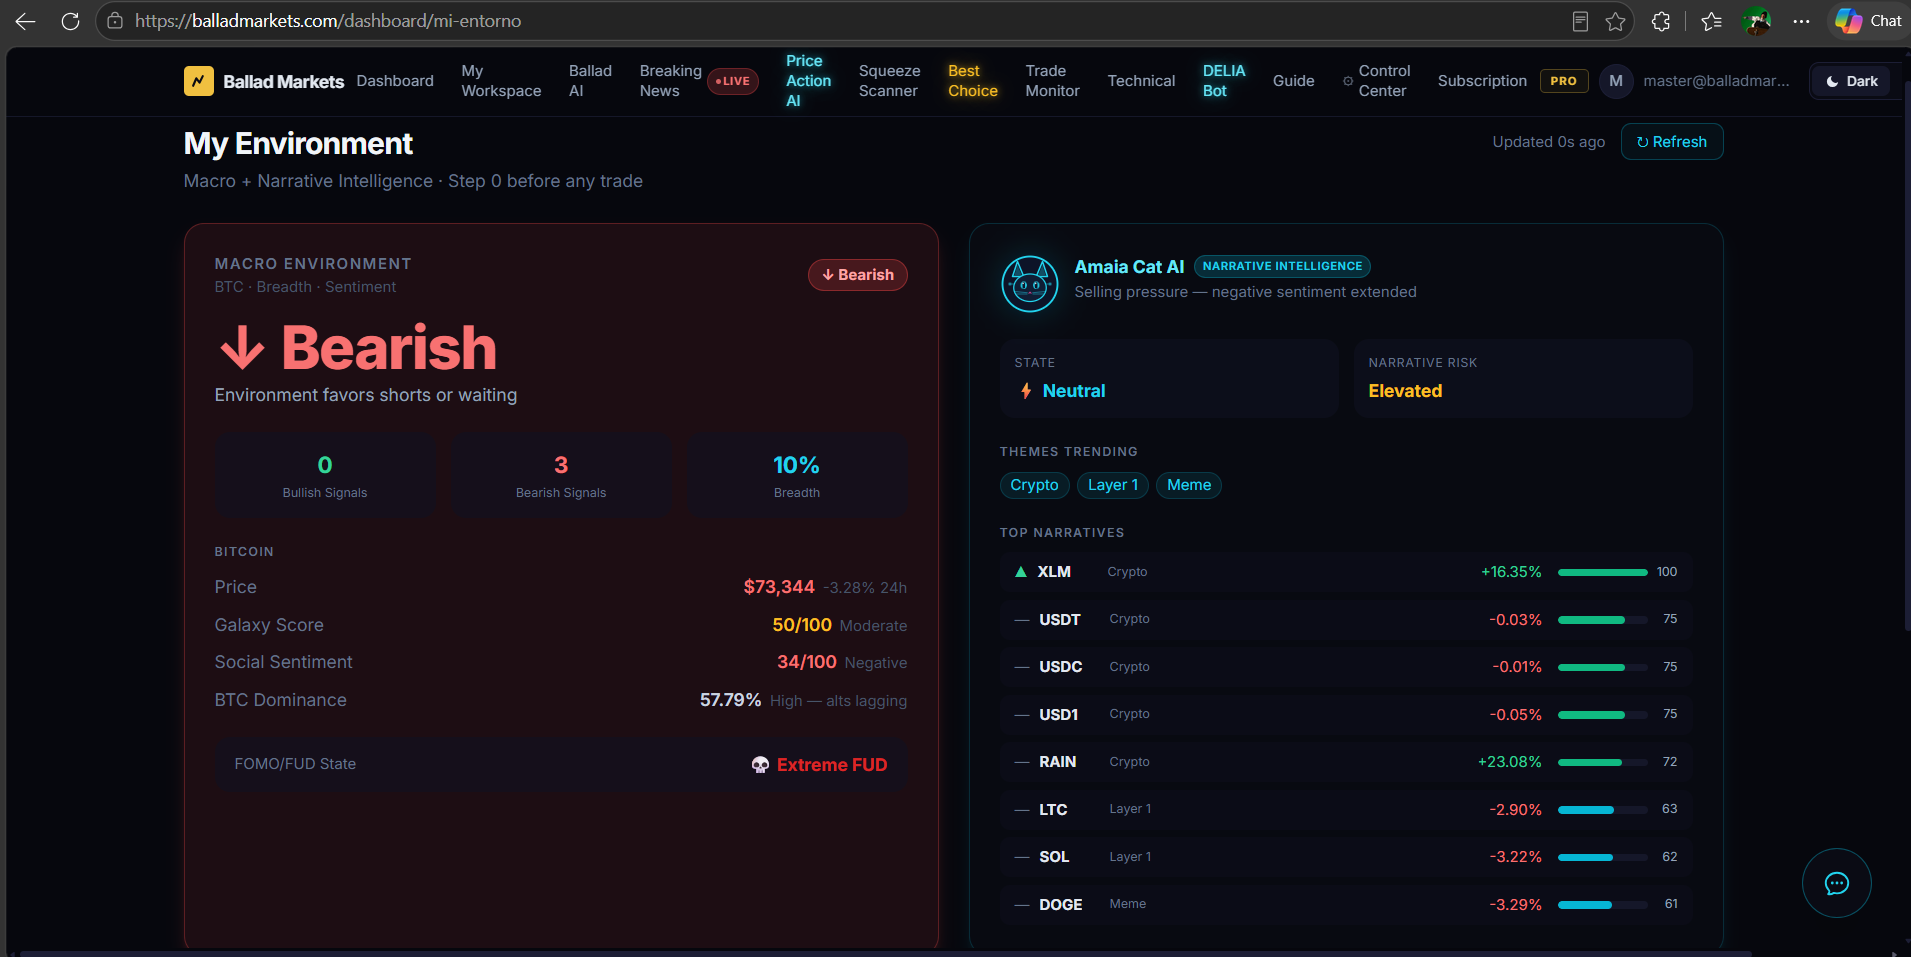
    AMAIA, our AI market analyst, processes sentiment data, social signals, and macro indicators before we touch a single chart. That morning, it was showing:

    • Sentiment: BEARISH / Extreme FUD
    • BTC: $73,344 — down 3.28%
    • Active signals: 0 bullish / 3 bearish
    AMAIA — My Environment dashboard. Bearish, Extreme FUD, BTC -3.28%. Zero bullish signals.

    Three bearish signals active, zero bullish. In that environment, fighting the trend does not mean being contrarian — it means ignoring the data. Decision made before opening a single chart: SHORT setups only, today.

    Step 2: Filter for Quality Setups (Price Action AI)

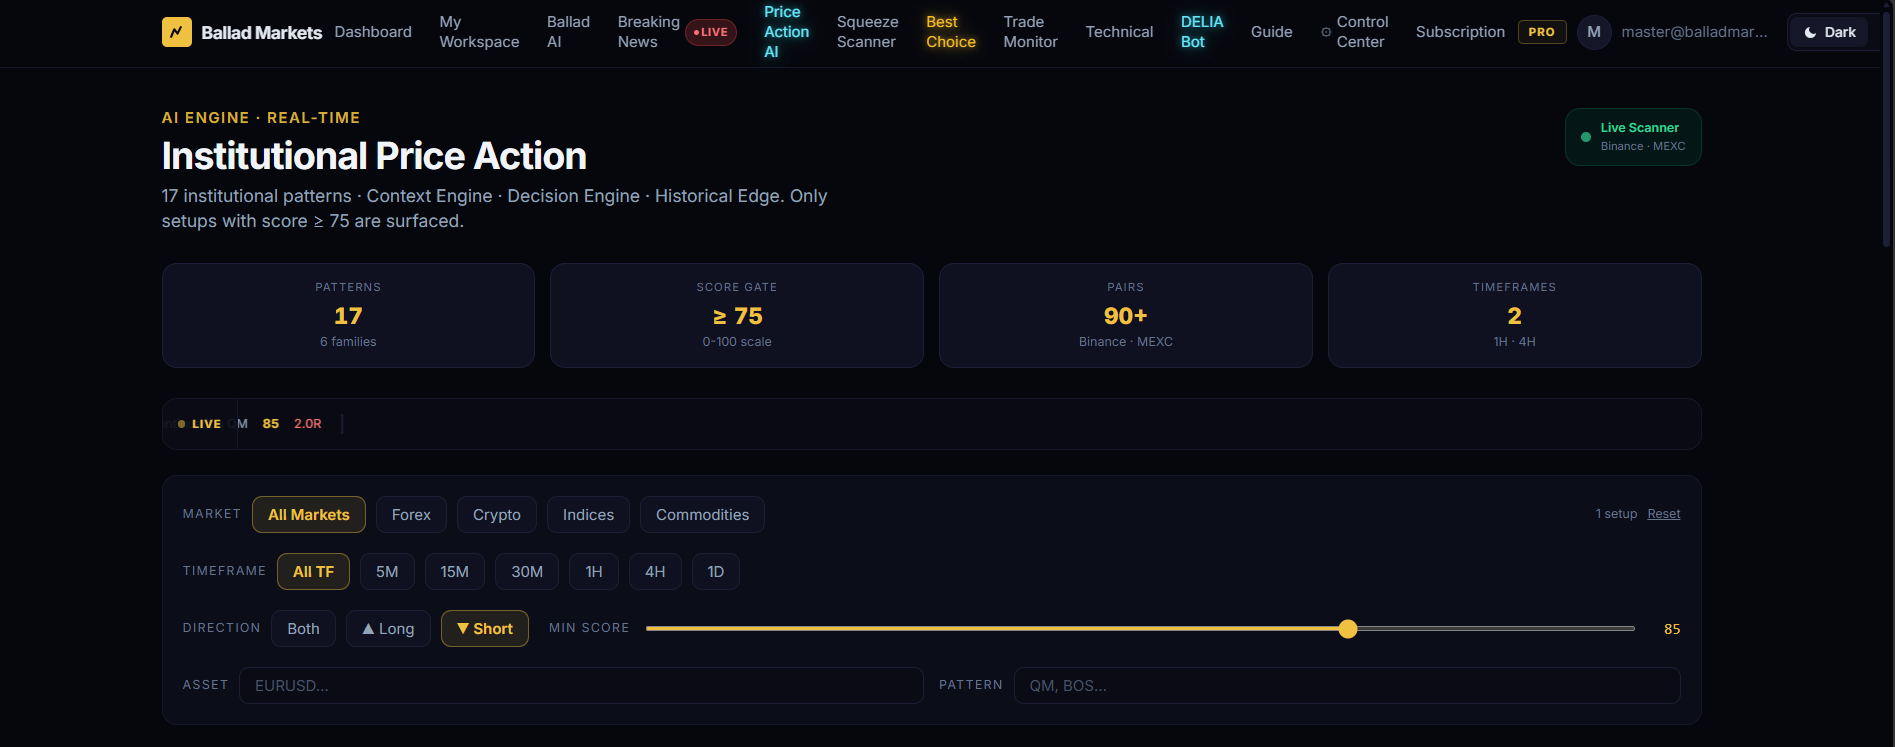
    With a SHORT bias confirmed by AMAIA, Price Action AI scanned the full universe of assets for institutional patterns. The filter is strict: score 85 or above, SHORT direction only. Below that threshold, the signal-to-noise ratio drops too much to act confidently.

    Price Action AI scanner with Short filter active, minimum score 85, 17 institutional patterns
    Price Action AI — 17 institutional patterns, 90+ pairs. Filter set to SHORT only, score ≥85.

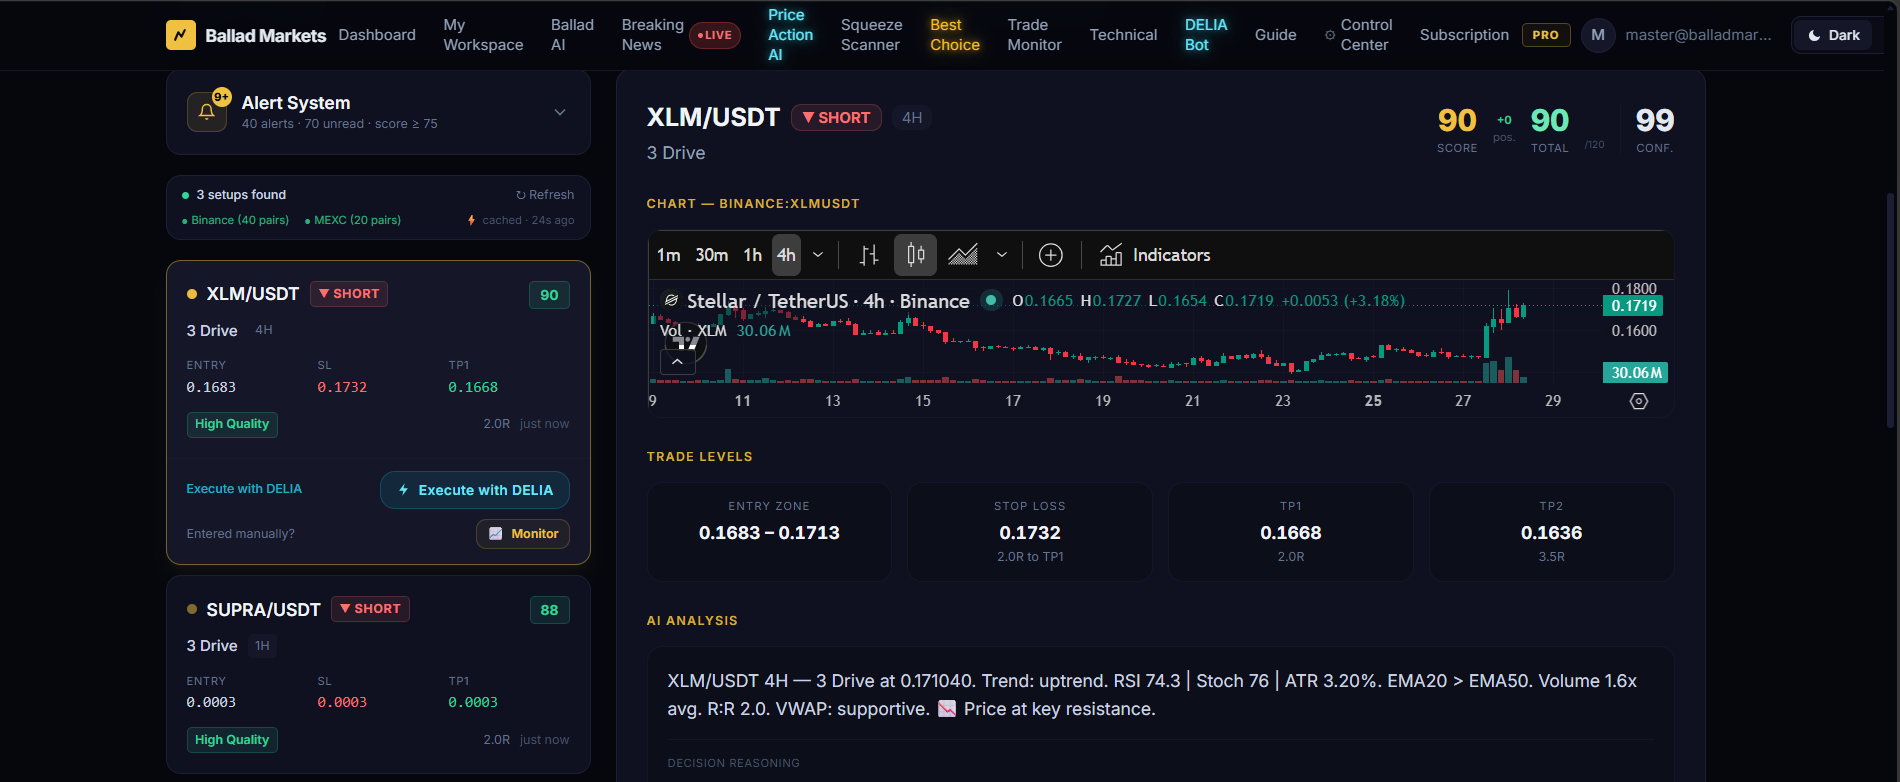
    Two setups cleared the bar immediately:

    AssetPatternTimeframeScore
    XLM/USDT3 Drive4H90 / 100
    SUPRA/USDT3 Drive1H88 / 100
    Price Action AI showing XLM/USDT 3 Drive SHORT Score 90 with chart and trade levels
    XLM/USDT — 3 Drive pattern on 4H, Score 90. Entry zone 0.1683–0.1713, SL 0.1732, TP1 0.1668.

    The 3 Drive is one of the most reliable reversal patterns in institutional price action — three equal pushes into a key level, exhaustion, then reversal. On a 4H chart with the macro environment confirming bearish pressure and a score of 90, everything is aligned.

    Step 3: Execute and Let the System Work (DELIA)

    DELIA, our execution bot, managed the trades from entry to close. Each position had pre-defined entries, stop losses, and three take-profit levels calculated from the pattern geometry. No discretion, no second-guessing mid-trade.

    DELIA Trade Monitor — ZECUSDT +20.34% (all 3 TPs hit), HYPEUSDT +9.60%, SUPRAUSDT +5.60%, PLAYUSDT +3.58%.

    These results come from paper trading mode — the same system, the same signals, the same execution logic as live trading, but without real capital at risk. This is intentional.

    Why Paper Trading in Live Conditions Is Not Optional

    There is a critical difference between backtesting and paper trading in live market conditions. Backtesting uses historical data — the outcome is already known. Paper trading in real time means you face the same volatility, the same news shocks, and the same pressure as live trading, without the financial risk.

    It is the honest way to know whether your system actually works before you commit real capital to it. Running paper mode in live conditions tells you more about reliability than years of backtests.

    The Framework in Four Steps

    1. Environment first (AMAIA) — never trade against confirmed macro sentiment. If the data says BEARISH, only look for SHORT.
    2. Pattern quality filter (Price Action AI) — only setups scoring 85+ on institutional price action. Below that, too many false positives.
    3. Systematic execution (DELIA) — pre-defined entries, stops, and three take-profit levels. No discretion.
    4. Paper validation before live capital — prove the system works in real market conditions first.

    The Takeaway

    Bear markets are not problems to be solved. They are environments to be read. When AMAIA shows extreme fear, zero bullish signals, and BTC dropping 3%, the correct response is not to look for a contrarian long — it is to ask where the best SHORT opportunities are hiding.

    That day, XLM and SUPRA were the answer. The system found them, scored them, and executed them. ZECUSDT hit all three take-profit levels.

    The market told us its direction. We listened.


    All results shown are from paper trading mode. Paper trading uses live market data and real-time signals but does not involve real capital. Past performance, whether live or simulated, does not guarantee future results. Trading cryptocurrencies involves significant risk. This post is for educational purposes only and does not constitute financial advice.

    Want to see the system in action?

    Ballad Markets gives you access to AMAIA, Price Action AI, and DELIA — the same tools shown in this post. Free account available.