Category: Equity Analysis

  • FLNC — Fluence Energy: la correccion que podria estar construyendo la proxima gran expansion energetica

    FLNC — Fluence Energy: la correccion que podria estar construyendo la proxima gran expansion energetica

    Ballad Markets House View · Rafael Acevedo — CEO, Ballad Markets

    La tesis

    Hay momentos en el mercado en los que una caída de precio debe interpretarse de otra manera. No toda caída representa deterioro estructural. Algunas representan simplemente el proceso mediante el cual el mercado elimina expectativas excesivas, comprime valoración y obliga a los inversores de corto plazo a abandonar una historia que, paradójicamente, puede estar fortaleciéndose por debajo.

    Fluence Energy (NASDAQ: FLNC) se encuentra en uno de esos puntos de inflexión. La acción cotiza muy por debajo de sus máximos anteriores mientras el negocio acaba de alcanzar su mayor backlog histórico. Esa divergencia entre precio y fundamentales es precisamente lo que la vuelve interesante.

    1. El mercado está castigando la ejecución, no la demanda

    Los últimos resultados explican la presión sobre la acción. En el tercer trimestre fiscal de 2026 Fluence produjo aproximadamente 649,8 millones de dólares de ingresos, pero el margen bruto GAAP cayó hasta el 5,1%, frente al 14,8% del mismo trimestre del año anterior. La compañía registró una pérdida neta de aproximadamente 44,3 millones.

    A primera vista, esos números justifican el castigo. Pero hay otra cara.

    Fluence consiguió más de 1.440 millones de dólares en nuevos pedidos durante el trimestre, casi el triple del nivel del mismo trimestre del año anterior. Y el backlog alcanzó aproximadamente 6.400 millones, el mayor de toda su historia: un 14% más que el trimestre anterior y más de un 30% interanual.

    El problema, por tanto, no parece ser si existe demanda. La pregunta correcta es si Fluence puede convertir esa demanda en ingresos y beneficios con eficiencia suficiente. Ésa es la batalla que determinará el próximo movimiento grande.

    2. El dato que cambia la ecuación: 2027

    A 30 de junio, aproximadamente 2.200 millones de los 6.400 del backlog estaban previstos para convertirse en ingresos durante el FY2027. Eso proporciona una base considerable de ingresos futuros ya contratados.

    La compañía ha reconocido que unos 400 millones en entregas se desplazan de FY2026 a FY2027 por problemas de producción en una nueva planta internacional de fabricación por contrato y retrasos de construcción en una instalación estadounidense. El guidance de ingresos FY2026 pasó a 2.900–3.100 millones desde 3.200–3.600, y el EBITDA ajustado a −30 a +10 millones desde 40–60.

    Esto es negativo. Pero también significa que parte de la actividad no desapareció: se desplazó. Por eso no interpretamos la revisión de guidance como deterioro permanente del negocio, sino como un problema de calendario y de fábrica.

    3. La segunda tesis: FLNC ya no es solamente almacenamiento

    Aquí nuestra visión se vuelve más agresiva. La demanda energética de los centros de datos está creciendo rápidamente, y Fluence está posicionándose directamente en ese mercado.

    La compañía informó aproximadamente 850 millones de negocio relacionado con centros de datos, incluyendo unos 550 millones adjudicados por un hyperscaler durante julio de 2026.

    Eso cambia la naturaleza de la historia. FLNC puede evolucionar desde storage company hacia infraestructura energética crítica para IA. Y esa diferencia puede justificar un múltiplo muy distinto — si consigue demostrar rentabilidad.

    4. La estructura técnica que vigilamos

    Nuestra lectura técnica plantea una estructura de Elliott en la que el movimiento anterior habría formado una onda ①, seguida de una corrección compleja A → B → C.

    La zona relevante aparece en los retrocesos de Fibonacci: 0,786 en 9,86 y 0,887 en 6,82, ambos por debajo de la cotización actual.

    Nuestra interpretación no es que FLNC tenga que visitar 6,82. Es que entre 9,86 y 6,82 aparece una zona donde la relación riesgo/recompensa empieza a cambiar radicalmente.

    5. Por qué esa zona importa

    Porque confluyen tres elementos: una corrección ya profunda, un backlog en récord, y una transformación estructural hacia data centers e infraestructura para hyperscalers. El precio baja mientras el backlog sube y el pipeline energético crece — el pipeline de Energy Storage Products & Solutions llegó a 45,6 GW y el backlog contratado a 12,6 GW, ambos muy por encima de septiembre de 2025.

    6. La hipótesis de una futura onda ③

    Ésta es la parte más especulativa. El gráfico plantea una potencial onda ③ con extensión Fibonacci de 1,618, situando un objetivo teórico cercano a 58,44.

    No consideramos 58,44 un precio objetivo fundamental. Es un objetivo técnico de expansión, condicionado a que la estructura sea realmente una onda ② terminada y a que el siguiente movimiento impulsivo se confirme. La diferencia importa: no estamos diciendo que FLNC vaya a 58. Estamos diciendo que si completa la corrección y confirma una nueva estructura impulsiva, el mercado podría tener espacio para una expansión muy grande.

    7. Qué tendría que suceder para confirmar la tesis

    No compramos una teoría porque el Fibonacci diga que hay oportunidad. Necesitamos confirmaciones, en este orden:

    • Primera — recuperación sostenida de la zona 17–18, una resistencia estructural importante.
    • Segunda — superación de 22–23, donde la señal técnica se vuelve más potente.
    • Tercera — recuperación de 28,63, nivel Fibonacci relevante.
    • Mayor — superación de 33,56, el máximo asociado a la estructura anterior. Una ruptura convincente invalidaría buena parte de la estructura bajista.

    8. ¿Y si sigue cayendo?

    Ésta es la parte más importante de la house view: no perseguimos el precio.

    Si FLNC cae hacia 9,86 la relación riesgo/recompensa mejora mucho. Si alcanza 6,82, la asimetría sería aún mayor. Pero un precio bajo no convierte automáticamente una acción en una buena inversión. Exigiríamos comprobar simultáneamente: liquidez suficiente, estabilización del margen, normalización de las fábricas, conversión del backlog, reducción del cash burn y crecimiento del negocio de data centers.

    9. Nuestra House View

    • Fundamental: positiva a largo plazo
    • Operativa: en transición
    • Corto plazo: alto riesgo
    • Largo plazo: alto potencial

    La contradicción es lo interesante. Fluence tiene 6.400 millones de backlog y problemas de ejecución. Tiene 850 millones en data centers y una rentabilidad todavía no demostrada. Tiene 1.440 millones en pedidos trimestrales y sigue en pérdidas.

    No estamos ante una empresa perfecta. Estamos ante una empresa potencialmente asimétrica.

    10. Conclusión

    La pregunta no es si FLNC puede seguir bajando. Por supuesto que puede. La pregunta importante es cuánto valor futuro está descontando el mercado a estos precios si Fluence resuelve sus problemas de ejecución.

    Nuestra respuesta: considerablemente menos de lo que podría valer una Fluence normalizada. El mercado mira las pérdidas actuales; nosotros miramos la combinación de backlog récord, almacenamiento energético, software, centros de datos y crecimiento de la demanda eléctrica.

    Pero con una condición: la tesis solo funciona si la compañía convierte backlog en ingresos y esos ingresos en flujo de caja.

    Por eso, para Ballad Markets: FLNC = WATCHLIST / ACCUMULATE ON WEAKNESS. No perseguir. No comprar todo de una vez. Esperar la zona de valor y dejar que el mercado confirme la estructura.


    Ficha · Ticker: FLNC · Sector: Energy Storage / Energy Technology · Tendencia fundamental: positiva · Tendencia técnica: bajista en transición · Riesgo: alto · Horizonte: 12–36 meses · Convicción: alta, condicionada a ejecución · Estrategia: acumulación escalonada en debilidad.

    Rafael Acevedo — CEO, Ballad Markets

    Las cifras financieras citadas corresponden a los resultados del tercer trimestre fiscal 2026 publicados por la compañía. Este contenido es análisis de mercado y house view institucional de Ballad Markets. No constituye asesoramiento de inversión ni recomendación personalizada. Los niveles de Fibonacci y objetivos de expansión son referencias técnicas condicionadas, no precios objetivo. Rendimientos pasados no garantizan resultados futuros. Opere con gestión de riesgo definida.
  • MP Materials: ¿The Next Big Thing de 2026?

    MP Materials: ¿The Next Big Thing de 2026?

    🔥 BALLAD MARKETS — CEO RAFAEL ACEVEDO HOUSE VIEW

    MP MATERIALS: ¿THE NEXT BIG THING DE 2026?

    Hay acciones que parecen una minera.

    Y hay acciones que, si entiendes bien la narrativa, pueden representar algo mucho más grande.

    MP Materials ($MP) es una de ellas.

    Mi tesis para 2026 es clara:

    🇺🇸 Rare Earths + 🇺🇸 Defense + 🤖 Robotics + 🤖 Physical AI + ⚡ Electrification

    pueden converger en una de las grandes narrativas industriales de esta década.

    Y MP está justo en el centro.

    China controla aproximadamente el 94% de la producción mundial de imanes permanentes y domina gran parte de la cadena de tierras raras.

    Pero el mundo está cambiando.

    La guerra tecnológica entre EE.UU. y China, la reindustrialización estadounidense, el crecimiento de los drones, la robótica, los vehículos eléctricos y la llegada de la Physical AI están convirtiendo los imanes de tierras raras en un activo estratégico.

    Y aquí está lo importante:

    MP ya no quiere ser solamente una minera.

    Su estrategia es construir una cadena integrada:

    ⛏️ Mine
    → Refining
    → Metal
    → Alloy
    → 🧲 Magnets
    → ♻️ Recycling

    Mountain Pass en California proporciona el recurso.

    Texas está convirtiéndose en el siguiente gran capítulo.

    MP está desarrollando 10X, un campus de fabricación de imanes de más de $1.25 BILLONES.

    Además, la compañía está desarrollando relaciones estratégicas con nombres como:

    🍎 Apple
    🚗 General Motors
    🇺🇸 U.S. Department of Defense

    Y aquí aparece mi verdadera tesis:

    AI necesita chips.

    Pero la Physical AI necesita máquinas.

    Robots.
    Drones.
    Vehículos autónomos.
    Sistemas industriales.
    Sistemas de defensa.

    Y esas máquinas necesitan motores.

    Y muchos de esos motores necesitan imanes permanentes de alto rendimiento.

    Por eso creo que el mercado puede estar cometiendo un error al mirar MP simplemente como “una empresa de tierras raras”.

    Mi lectura es diferente:

    MP podría convertirse en parte de la infraestructura física de la próxima generación de AI.

    El mercado todavía está obsesionado con:

    NVIDIA → Chips → Data Centers

    Pero la siguiente fase podría ser:

    AI → Physical AI → Robotics → Motors → Magnets → Rare Earths

    Y ahí aparece MP.


    🔥 THE BALLAD MARKETS THESIS

    No estoy diciendo que MP sea la próxima NVIDIA.

    Estoy diciendo algo más interesante:

    MP podría pasar de ser valorada como una minera a ser valorada como un activo estratégico de infraestructura industrial estadounidense.

    Ese cambio de narrativa puede ser extremadamente poderoso.

    Porque estamos viendo cinco megatendencias converger:

    🇺🇸 American Reindustrialization
    🇨🇳 U.S.–China Supply Chain Decoupling
    🛡️ Defense Tech
    🤖 Physical AI & Robotics
    ⚡ Electrification

    Y todas necesitan materiales.

    Ballad Markets Narrative Score: 9.0 / 10

    🟢 Strategic importance: 10/10
    🟢 Government support: 10/10
    🟢 Defense: 9.5/10
    🟢 AI/Robotics: 9/10
    🟢 Narrative acceleration: 9.5/10
    🟡 Execution: 7/10
    🔴 Risk: 8/10

    House View

    🟢 STRUCTURAL BULLISH

    La gran pregunta no es:

    “¿Subirá MP?”

    La pregunta que debemos hacernos es:

    ¿Está naciendo una nueva categoría estratégica alrededor de las tierras raras y los imanes?

    Mi respuesta:

    Creo que sí.

    Y si esa narrativa continúa acelerándose durante 2026, MP Materials podría convertirse en uno de los nombres que definan esta nueva carrera industrial.

    From Mine → Materials → Magnets → Strategic Infrastructure.

    Rafael Acevedo

    CEO | Ballad Markets

    #BalladMarkets #MPMaterials #MP #RareEarths #AI #PhysicalAI #Robotics #DefenseTech #CriticalMinerals #USManufacturing #Investing #Stocks #ArtificialIntelligence #NVIDIA #EV #Geopolitics

  • House View | ALNY: Cuando el mercado confunde una desaceleración con un deterioro estructural

    House View | ALNY: Cuando el mercado confunde una desaceleración con un deterioro estructural

    House View | Rafael Acevedo, CEO de BalladMarkets.com

    Tesis Humana Inicial Neuronal
    Análisis técnico validado por Darwin | Motor de inteligencia de inversión Chesko 2.0

    En BalladMarkets no buscamos compañías que simplemente hayan caído. Buscamos momentos en los que el mercado sobrerreacciona y el precio se desvía significativamente del valor fundamental del negocio.

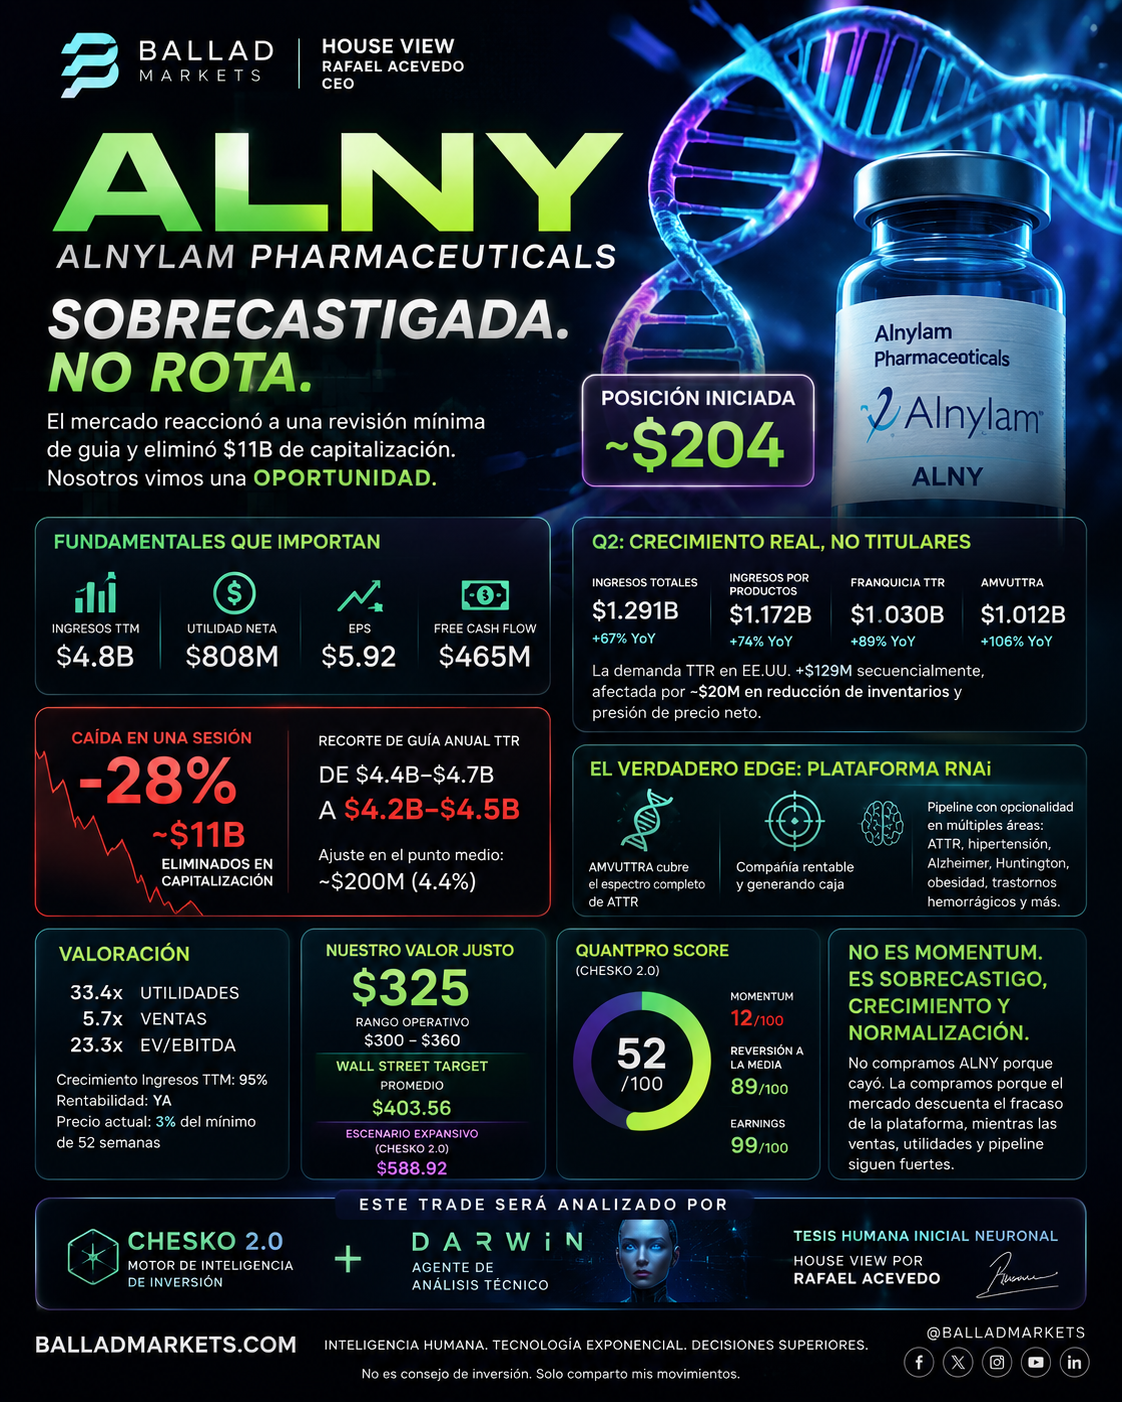
    Bajo esa premisa, hemos iniciado una posición en Alnylam Pharmaceuticals (NASDAQ: ALNY) alrededor de los 204 dólares.

    Nuestra tesis parte de una lectura sencilla: el mercado parece estar descontando un deterioro estructural de la compañía cuando, en nuestra opinión, los datos reflejan una desaceleración puntual dentro de un negocio que continúa creciendo con fuerza.

    ¿Qué provocó la caída?

    ALNY perdió aproximadamente un 28% en una sola sesión, eliminando cerca de 11.000 millones de dólares de capitalización bursátil.

    El detonante fue la revisión de la guía anual de ventas de su franquicia TTR, que pasó de un rango de 4.400–4.700 millones a 4.200–4.500 millones de dólares.

    En términos prácticos, el ajuste representa apenas unos 200 millones de dólares en el punto medio de la previsión, alrededor del 4,4%.

    La magnitud de la caída del precio parece haber sido muy superior al deterioro real de las expectativas del negocio.

    Lo que los fundamentales muestran

    Mientras gran parte del mercado reaccionaba al titular, los resultados financieros cuentan una historia diferente.

    • Ingresos TTM: 4.800 millones de dólares.
    • Beneficio neto: 808 millones.
    • EPS: 5,92 dólares.
    • Free Cash Flow: aproximadamente 465 millones.

    Durante el segundo trimestre:

    • Los ingresos totales crecieron un 67% interanual, alcanzando 1.291 millones de dólares.
    • Los ingresos por productos aumentaron un 74%.
    • La franquicia TTR registró un crecimiento del 89%.
    • AMVUTTRA superó los 1.000 millones de dólares en ventas, creciendo un 106% frente al año anterior.

    En nuestra opinión, estos datos no describen una empresa en deterioro. Describen una compañía que sigue expandiendo su negocio mientras el mercado ajusta expectativas sobre la velocidad de crecimiento.

    La verdadera tesis

    El activo más importante de Alnylam no es un único medicamento.

    Es su plataforma de terapias basadas en RNA de interferencia (RNAi).

    La compañía ya ha demostrado que puede convertir innovación científica en productos comercializados y rentables.

    Además de AMVUTTRA, mantiene programas con potencial en áreas como:

    • hipertensión,
    • enfermedad de Alzheimer,
    • enfermedad de Huntington,
    • obesidad,
    • trastornos hemorrágicos,
    • nuevas indicaciones dentro del espectro ATTR.

    Esta diversificación reduce la dependencia de un único producto y mantiene abierta una importante opcionalidad de crecimiento para los próximos años.

    Valoración

    Tras la corrección, ALNY cotiza aproximadamente a:

    • 33,4 veces beneficios
    • 5,7 veces ventas
    • 23,3 veces EV/EBITDA

    No hablamos de una acción barata desde una perspectiva tradicional de múltiplos.

    Sin embargo, esos múltiplos corresponden a una empresa cuyos ingresos han crecido cerca del 95% durante los últimos doce meses y que ya ha cruzado hacia una etapa de rentabilidad sostenida.

    En nuestra valoración interna, estimamos un valor razonable operativo cercano a 325 dólares, con un rango de entre 300 y 360 dólares.

    Como referencia, el consenso de Wall Street mantiene un precio objetivo medio cercano a 404 dólares.

    Validación mediante Chesko 2.0 y Darwin

    La tesis fundamental fue desarrollada inicialmente bajo nuestro modelo de Tesis Humana Inicial Neuronal, liderado por Rafael Acevedo.

    Posteriormente fue evaluada mediante:

    Chesko 2.0, encargado de integrar fundamentos, valoración, riesgo y escenarios de mercado.

    Y Darwin, nuestro nuevo agente especializado en análisis técnico, que estudia estructura del precio, soportes, resistencias, momentum, reversión estadística y probabilidad de continuación.

    El resultado de ambos sistemas coincide con la hipótesis principal:

    No estamos frente a una operación basada en impulso. Estamos ante una posible oportunidad de sobrecastigo donde el precio parece haberse alejado más rápido que el deterioro real del negocio.

    Riesgos

    Toda inversión implica incertidumbre.

    Los principales riesgos que identificamos son:

    • una desaceleración mayor de AMVUTTRA,
    • presión adicional sobre precios y acceso de pacientes,
    • resultados clínicos desfavorables,
    • riesgos regulatorios propios del sector farmacéutico.

    Estos factores podrían modificar nuestra tesis si cambian significativamente los fundamentales.

    Conclusión

    En BalladMarkets creemos que las mejores oportunidades suelen aparecer cuando el mercado reacciona de forma desproporcionada frente a cambios relativamente pequeños en las expectativas.

    ALNY reúne varias características que consideramos atractivas:

    ✔ Crecimiento operativo sólido.
    ✔ Rentabilidad demostrada.
    ✔ Generación de flujo de caja.
    ✔ Plataforma tecnológica con múltiples oportunidades futuras.
    ✔ Corrección bursátil que, en nuestra opinión, supera ampliamente el deterioro observado en los fundamentales.

    Seguiremos monitorizando esta posición mediante nuestro proceso de análisis continuo, combinando la experiencia humana con la validación cuantitativa y técnica de Chesko 2.0 y Darwin.

    House View
    Rafael Acevedo
    CEO | BalladMarkets.com

    “La mejor inteligencia artificial no reemplaza al criterio humano; lo pone constantemente a prueba.”

    Descargo de responsabilidad: Este documento refleja únicamente nuestra opinión y nuestro proceso de análisis. No constituye asesoramiento financiero ni una recomendación de compra o venta de valores. Cada inversor debe realizar su propia investigación y evaluar su perfil de riesgo antes de tomar decisiones de inversión.

  • House View — UiPath (PATH): The AI-chain Play the Market Gave Up On

    House View — UiPath (PATH): The AI-chain Play the Market Gave Up On

    Ballad Markets · Desk View · July 2026

    There is a specific kind of setup this desk waits for: a company whose fundamentals are inflecting upward while its share price is making multi-year lows. Not a broken business trading cheap — a repairing business trading cheap. UiPath is that setup today.

    The stock changes hands near $10, down from roughly $12.15 earlier this month and within touching distance of its 52-week low of $9.20. Its all-time high, set in May 2021, was $85.12. The market has spent three years pricing UiPath as a melting ice cube.

    The financials no longer support that story.

    What actually happened last quarter

    UiPath reported Q1 fiscal 2027 (quarter ended April 30, 2026) on May 28:

    Metric Result
    Revenue $418M, +17% YoY
    ARR $1.901B, +12% YoY
    Net new ARR $49M
    Net retention 109%
    GAAP operating income +$28M — first positive quarter in company history
    Non-GAAP operating income $92M
    Non-GAAP gross margin 83%
    Adjusted free cash flow $130M
    Cash & securities $1.42B, no debt
    Buyback $244M of Class A stock repurchased in the quarter

    The line that matters is the fifth one. UiPath turned GAAP-profitable for the first time. For a company the market had written off as a perpetual cash-burner, that is a change in kind, not degree — and it happened while revenue still grew 17%.

    Management’s own guidance carries it forward:

    • Q2 FY27: revenue $395–400M, ARR $1.929–1.934B, non-GAAP operating income ~$75M
    • Full-year FY27: revenue $1.776–1.781B, ARR $2.058–2.063B, non-GAAP operating income ~$430M

    That full-year operating income figure against ~$1.78B of revenue implies roughly a 24% non-GAAP operating margin — from a company that ran near breakeven two years ago. Meanwhile it holds $1.42B in net cash against a market capitalisation of roughly $5.5B, meaning a quarter of the market cap is cash.

    Why the price is where it is

    We are not going to pretend the bear case doesn’t exist. On July 23, UBS cut its price target to $12 from $13 and kept a Neutral rating, reflecting broader scepticism about automation demand. That scepticism is the reason the entry exists, and it rests on a real question: does classic RPA get commoditised by general-purpose AI?

    The honest answer is that it is a genuine risk. Microsoft bundles Power Automate. Foundation-model vendors keep absorbing adjacent workflows. If enterprise automation collapses into whatever the model providers ship for free, UiPath’s moat erodes.

    Our read is that this conflates two different things. A language model can draft a process. It cannot, on its own, govern one — permissions, audit trails, deterministic retries, compliance evidence in a regulated bank. Orchestration is where the durable value sits, and orchestration is what UiPath sells.

    The AI-chain thesis

    The reason PATH enters our watchlist as a fundamental AI-chain position rather than a bounce trade: it is levered to enterprise AI deployment, not AI capability.

    The market has paid up enormously for the layer that builds intelligence — chips, compute, foundation models. It has paid almost nothing for the layer that puts that intelligence to work inside a regulated enterprise and proves it did what it claimed. Every agent an enterprise deploys needs to be scheduled, permissioned, monitored and audited. That is not a model problem. That is an orchestration problem.

    Two data points suggest the shift is already monetising. On UiPath’s Q1 call, management noted AI-attached deals sold materially larger than those without. And the customer evidence is concrete rather than theoretical:

    • Suncoast reviewed 155,000+ checks with agentic automation, stopped 400 fraud attempts, and prevented $3.3M in losses
    • USI processes data 80% faster
    • Federal Bank merged 250 records an hour, continuously — work that previously consumed a full employee day for 200–300 records

    The named enterprise base spans regulated and industrial sectors: Generali Investments, Hiscox, HUB, WEX, Libra Internet Bank, Omega Healthcare, DTE Energy, Continental Resources, Tetra Pak, Woolworths, SOCAR, TAURON, One NZ.

    These are unglamorous companies. That is the point. This is where automation gets bought with real budgets and renewed on real ROI.

    The market

    Third-party estimates put RPA and hyperautomation at roughly $22.6B in 2025 scaling toward $110B by 2034 — a high-teens compound growth rate. Gartner has placed UiPath in the Leaders quadrant for six consecutive years.

    We would treat the market-size figure as directional rather than precise; forecasts nine years out are scenarios, not facts. The relevant point is simpler: the category is growing, and the category leader trades at roughly 3× forward sales while generating cash.

    The desk’s framework

    Horizon: 3–5 years. This is a position, not a trade. The thesis needs multiple quarters of margin expansion to be repriced, and that is measured in earnings reports, not weeks.

    Scenario Revenue CAGR Op. margin Framework value
    Bull ~25% ~27% $25–28
    Base ~15% ~24% $14–16
    Bear ≤10% ~20% $8–9

    The asymmetry is what earns the position. From roughly $10, the base case is a meaningful gain, the bull case is a multiple of the current price, and the bear case is bounded — partly because $1.42B of net cash puts a floor under a business that no longer burns money.

    What invalidates this: two consecutive quarters of decelerating net-new ARR, a reversal of the GAAP profitability, or net retention breaking below ~105%. Any of those means the operating leverage story broke, and the position should be reconsidered on the evidence rather than defended.

    What we are watching next

    Q2 FY2027 results are scheduled for September 8, 2026, after the close. That is the next real test. The bar management set is revenue of $395–400M and ARR of $1.929–1.934B.

    We hold a constructive view into that print — the last four quarters have shown consistent operating discipline, and guidance has been met. But we will state plainly what we do not know: no one can predict an earnings result, and anyone who tells you they are certain of one is selling something. The position is sized for a thesis that plays out over years, precisely so that a single quarter does not decide it.


    PATH is added to the Ballad house view as our fundamental AI-chain watchlist position. CHESKO’s desk agents will run their debate on it and publish their independent read — including, if they find it, the case against.


    Ballad Markets publishes its house view for research and educational purposes. This is market commentary, not personalised investment advice, and it is not a recommendation to buy or sell any security. We may hold positions in the instruments discussed. Markets carry risk of loss; do your own work and consider your own circumstances.

  • Five Names, One Thesis, Two Broken Charts

    Five Names, One Thesis, Two Broken Charts

    The electrification trade is one story told by five instruments: copper out of the ground (FCX), the battery supply chain in two wrappers (BATT, LIT), the legacy automaker betting the company on EVs (GM), and the hydrocarbons still powering the grid that charges them (MTDR).

    One thesis. Five charts. And the charts do not agree.

    The split nobody wants to publish

    Here is where the five actually stand as of the July 21 close — price against its own trend, and where it sits inside its 52-week range:

    Name Price vs 20d vs 50d 52w position
    MTDR 54.08 +5.1% +0.7% 49%
    GM 79.52 +2.9% +0.9% 53%
    FCX 62.56 +2.7% −1.8% 55%
    BATT 14.43 −2.7% −9.9% 17%
    LIT 69.08 −6.3% −13.7% 10%

    The top three are above their 20-day and sitting mid-range. The bottom two are near 52-week lows and roughly 10% below their 50-day.

    That is not one trade. It is three pullbacks and two downtrends.

    Why BATT and LIT are not “cheap”

    There is a tell that separates a pullback from a falling knife, and it is not the percentage off the high.

    Run the Fibonacci retracement on the last 60 days for LIT and the golden pocket — the 0.618–0.705 zone where healthy retracements find buyers — sits at 74.21–76.41. LIT trades at 69.08. The price is already below the zone that was supposed to hold it. Same structure on BATT: golden pocket 15.08–15.45, price 14.43.

    When the retracement level is above the price, the retracement failed. What is left is a downtrend, and every “support” inside it is a step on the way down, not a floor.

    We are not going to give you an entry on either. Not because they cannot work — the lithium supply glut has an expiry date — but because there is no structure to lean on yet. The honest level to watch on LIT is a reclaim of the 50-day at 80.03. Until then it is a chart in a downtrend with a good story attached, and a good story is not a stop-loss.

    The three that are actually in play

    FCX — 62.56. The cleanest confluence of the group. The 60-day golden pocket lands at 60.44–61.90 and the 20-day sits at 60.93 — two independent methods pointing at the same shelf near 61. Note the ATR: 4.5% daily range, the most volatile name here, which is an argument for a smaller position rather than a wider stop. Structure breaks below 59.

    GM — 79.52. The healthiest tape: above both the 20- and 50-day, mid-range. First support is the 20-day at 77.27; the deeper, higher-quality zone is the golden pocket at 74.85–76.15. Patience is rewarded differently here — the shallow entry is more likely to fill, the deep one is worth more if it comes. Structure breaks below 74.

    MTDR — 54.08. A caveat worth stating: it is already inside its golden pocket (52.95–54.30). That sounds like an entry until you notice it is also 5.1% extended above its 20-day — the most stretched name of the three. Those two facts together say the zone is technically live but the price has not corrected into it with any margin. The 20-day at 51.47 is where the risk-reward actually improves. Structure breaks below 48.

    What this is really about

    The reason to publish the two names that are broken alongside the three that are working is simple: a watchlist where everything is a buy is not analysis, it is marketing.

    Copper, lithium, EVs and the power to run them are the same secular bet. But secular is a decade and a stop-loss is a week, and conflating those is how a thesis becomes a bag. The thesis tells you what to own. The chart tells you when — and right now it is saying yes to three of these and not yet to two.

    Every position CHESKO 2.0 takes on this or anything else is published as it happens, wins and losses, at balladmarkets.com/chesko.


    Levels calculated from daily closes through July 21, 2026. Ballad Markets is a market analysis and information service, not personalized financial advice. Levels are analytical reference points, not recommendations, and every one of them can fail. You are responsible for your own risk.